

Question: An analyst ran a regression for the last 60 months with the monthly returns for Procter and Gamble (PG) as the dependent variable and
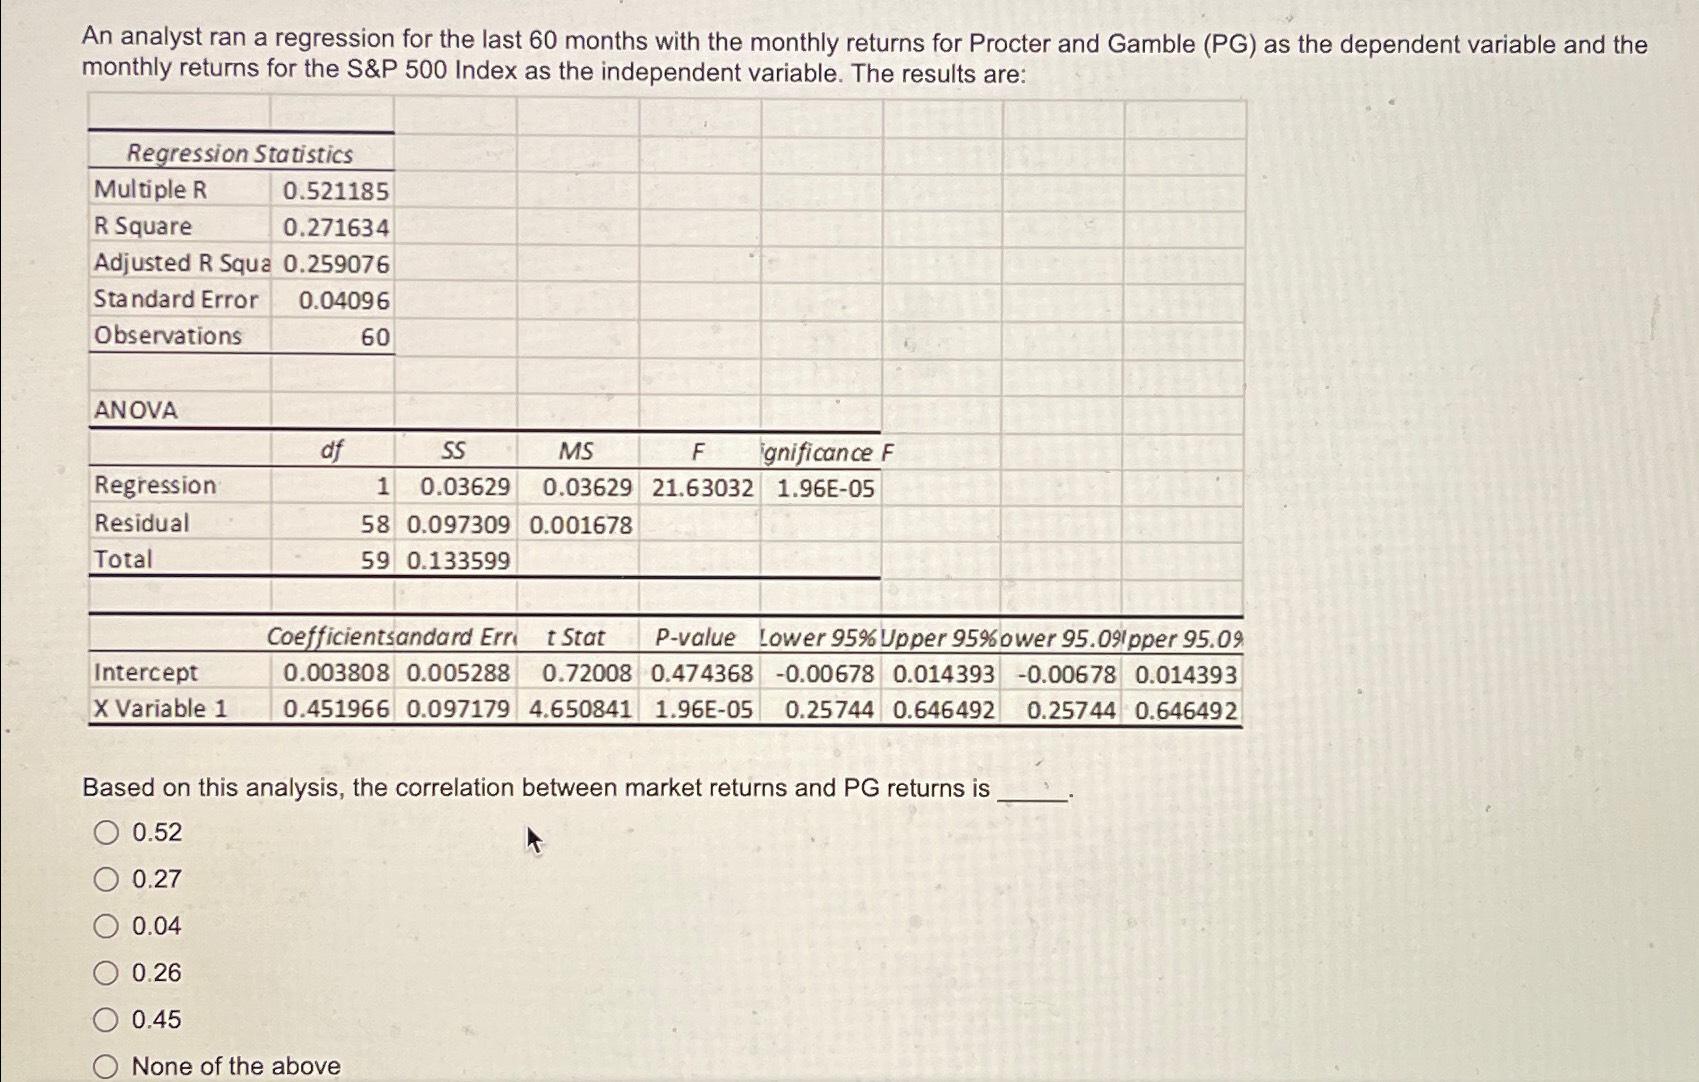
An analyst ran a regression for the last 60 months with the monthly returns for Procter and Gamble (PG) as the dependent variable and the monthly returns for the S&P 500 Index as the independent variable. The results are: Regression Statistics Multiple R R Square 0.521185 0.271634 Adjusted R Squa 0.259076 Standard Error Observations 0.04096 60 ANOVA df Regression Residual Total SS MS F ignificance F 1.96E-05 1 0.03629 0.03629 21.63032 58 0.097309 0.001678 59 0.133599 Coefficientsandard Err t Stat Intercept X Variable 1 0.003808 0.005288 0.72008 0.474368 0.451966 0.097179 4.650841 1.96E-05 P-value Lower 95% Upper 95%ower 95.09pper 95.09 -0.00678 0.014393 -0.00678 0.014393 0.25744 0.646492 0.25744 0.646492 Based on this analysis, the correlation between market returns and PG returns is 0.52 0.27 0.04 0.26 0.45 None of the above
Step by Step Solution
There are 3 Steps involved in it

Get step-by-step solutions from verified subject matter experts