

Question: An analyst ran a regression for the last 60 months with the monthly returns for Procter and Gamble (PG) as the dependent variable and
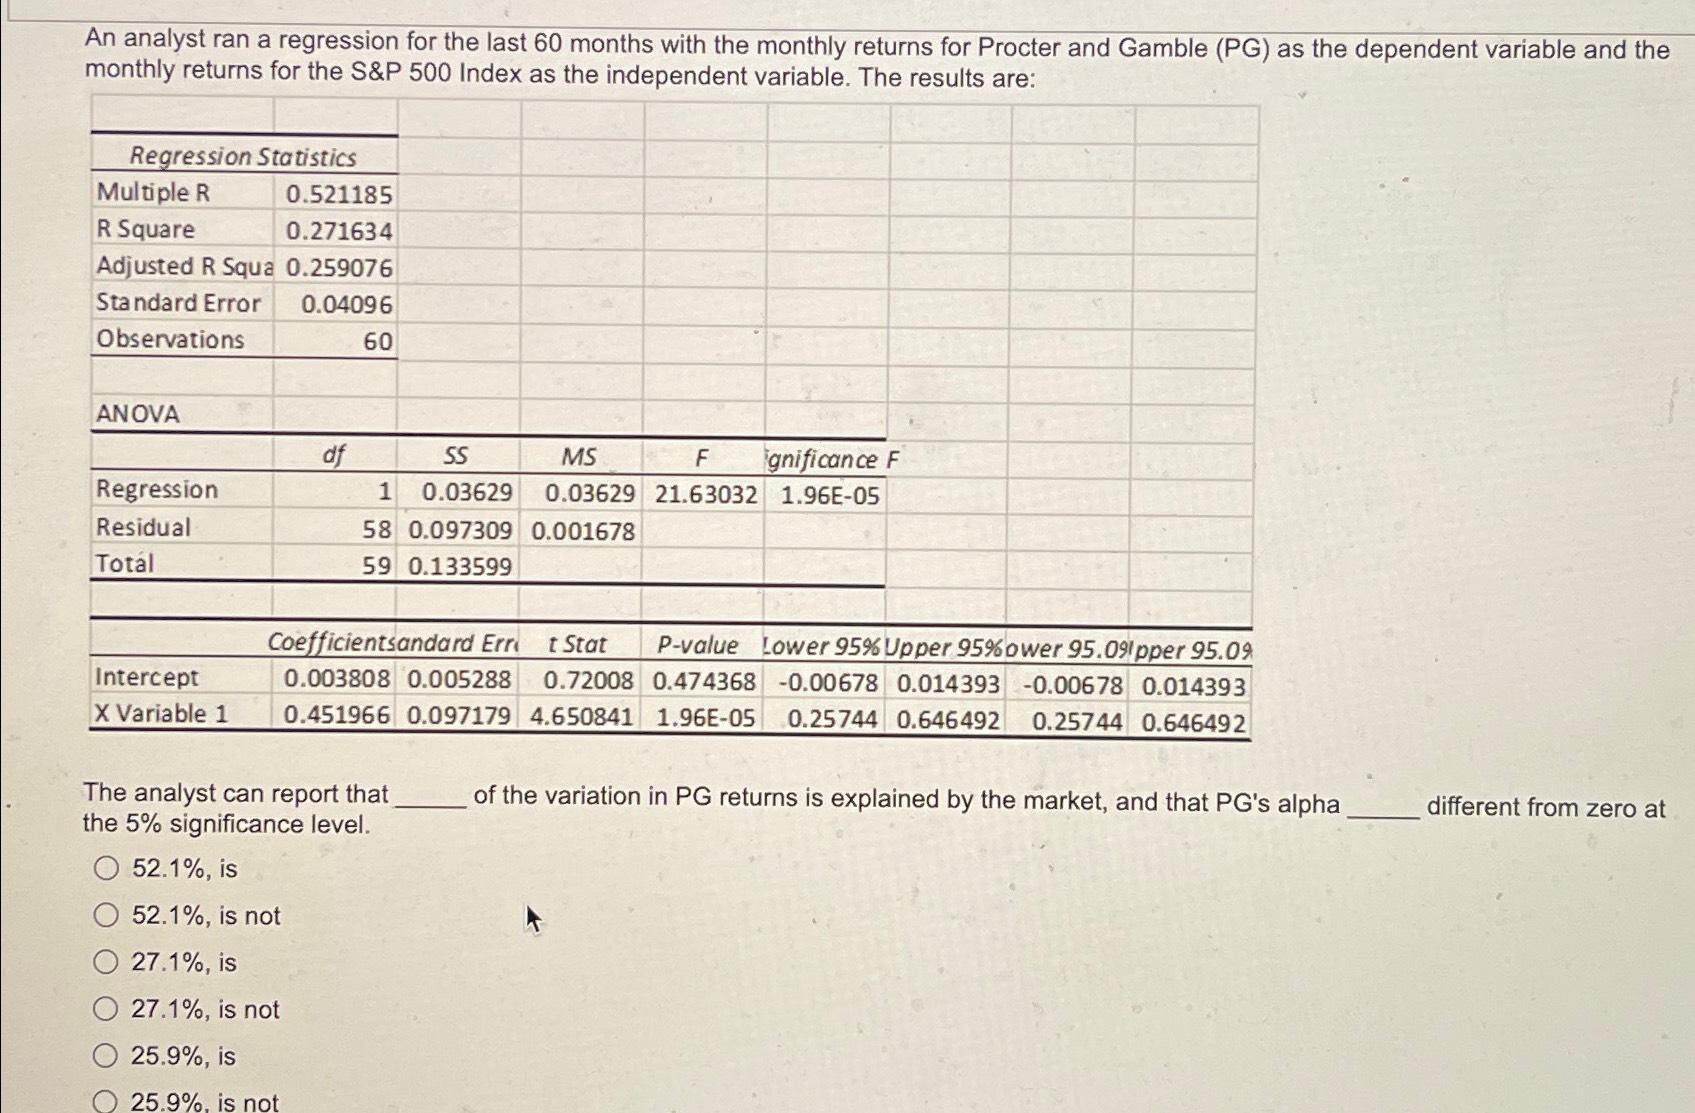
An analyst ran a regression for the last 60 months with the monthly returns for Procter and Gamble (PG) as the dependent variable and the monthly returns for the S&P 500 Index as the independent variable. The results are: Regression Statistics Multiple R R Square 0.521185 0.271634 Adjusted R Squa 0.259076 Standard Error Observations ANOVA 0.04096 60 df Regression Residual Total SS MS F gnificance F 1 0.03629 0.03629 21.63032 1.96E-05 58 0.097309 0.001678 59 0.133599 Coefficientsandard Err t Stat 0.003808 0.005288 P-value Lower 95% Upper 95% ower 95.091pper 95.09 0.72008 0.474368 -0.00678 0.014393 -0.00678 0.014393 0.451966 0.097179 4.650841 1.96E-05 0.25744 0.646492 0.25744 0.646492 of the variation in PG returns is explained by the market, and that PG's alpha different from zero at Intercept X Variable 1 The analyst can report that the 5% significance level. 52.1%, is 52.1%, is not 27.1%, is 27.1%, is not 25.9%, is 25.9%, is not
Step by Step Solution
There are 3 Steps involved in it

Get step-by-step solutions from verified subject matter experts