

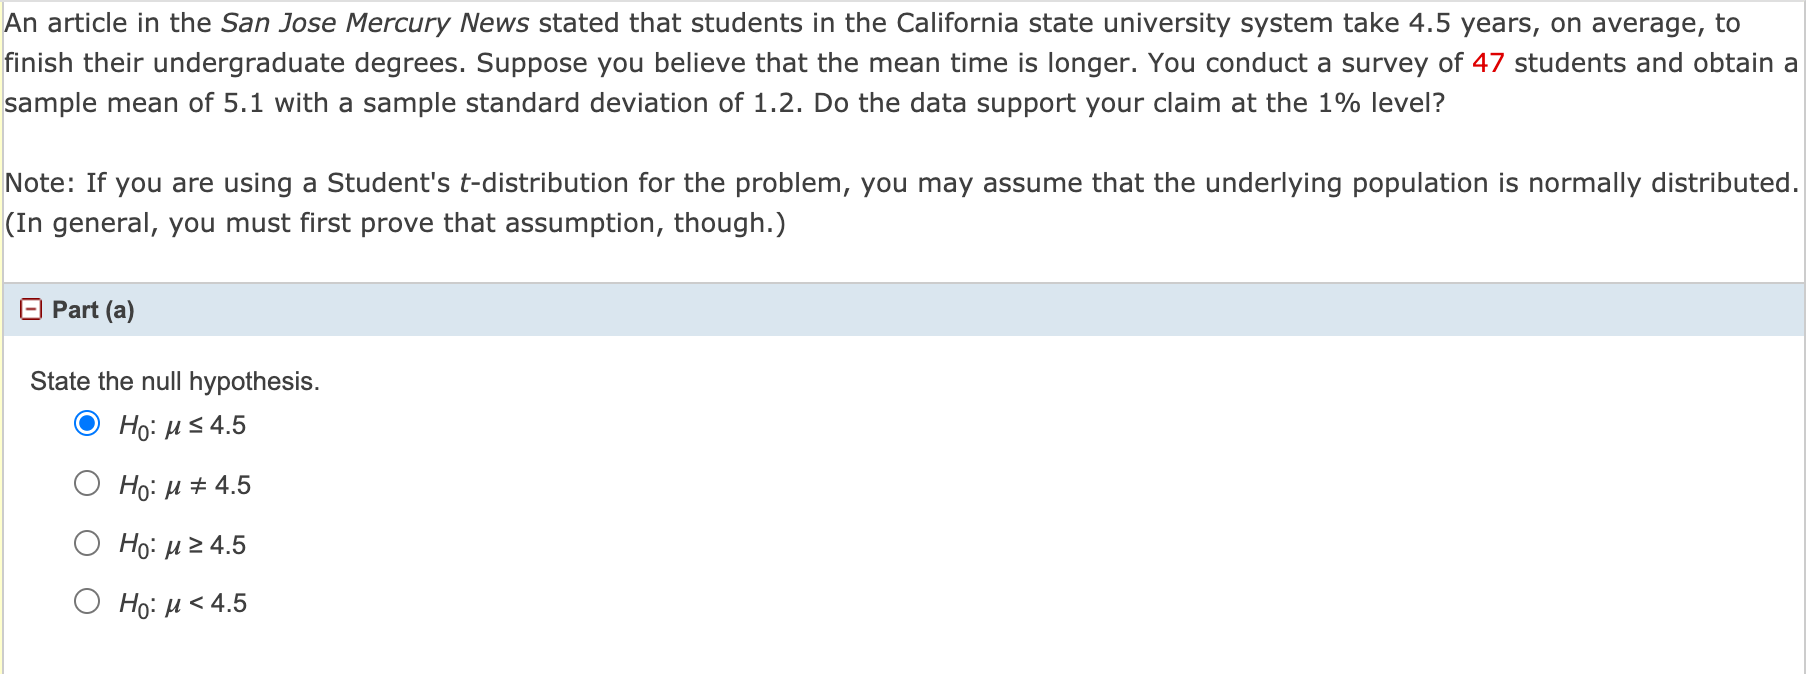
An article in the San Jose Mercury News stated that students in the California state university...
Fantastic news! We've Found the answer you've been seeking!
Question:
Transcribed Image Text:
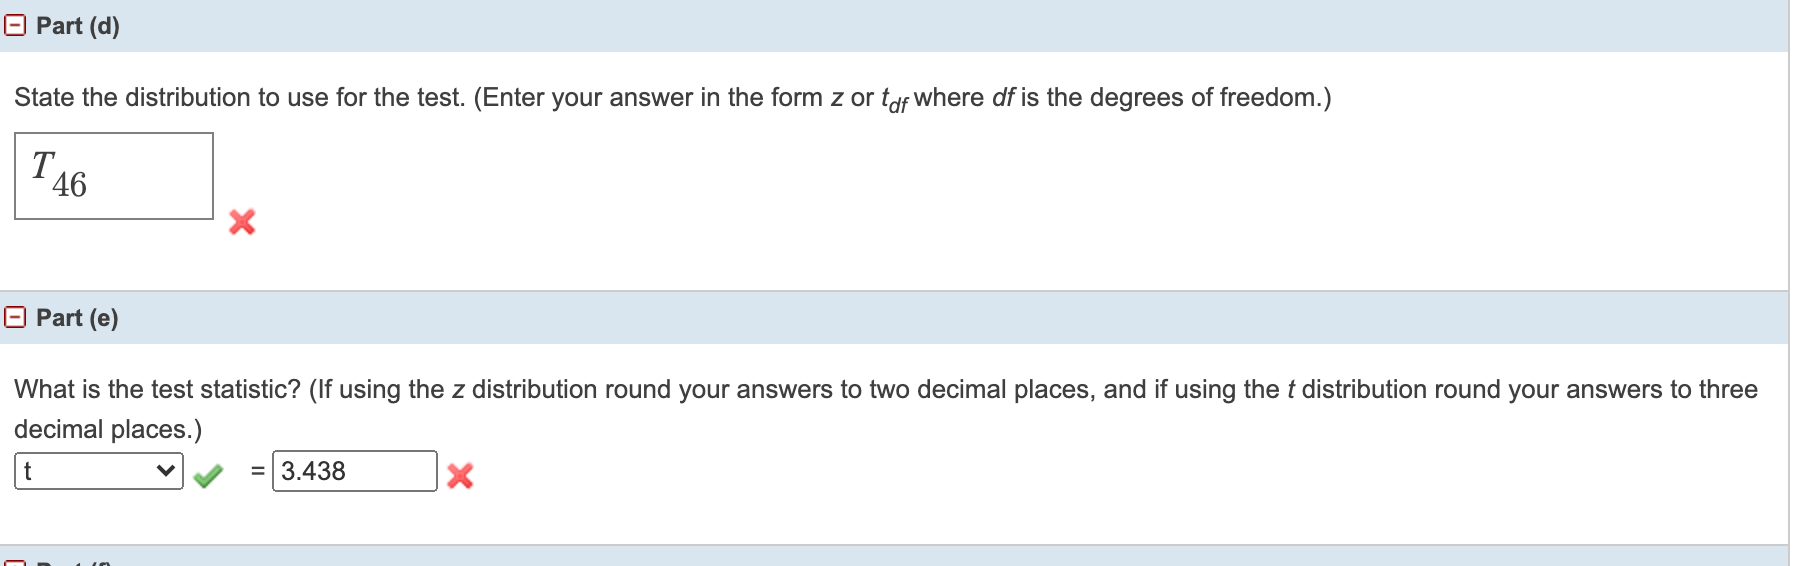
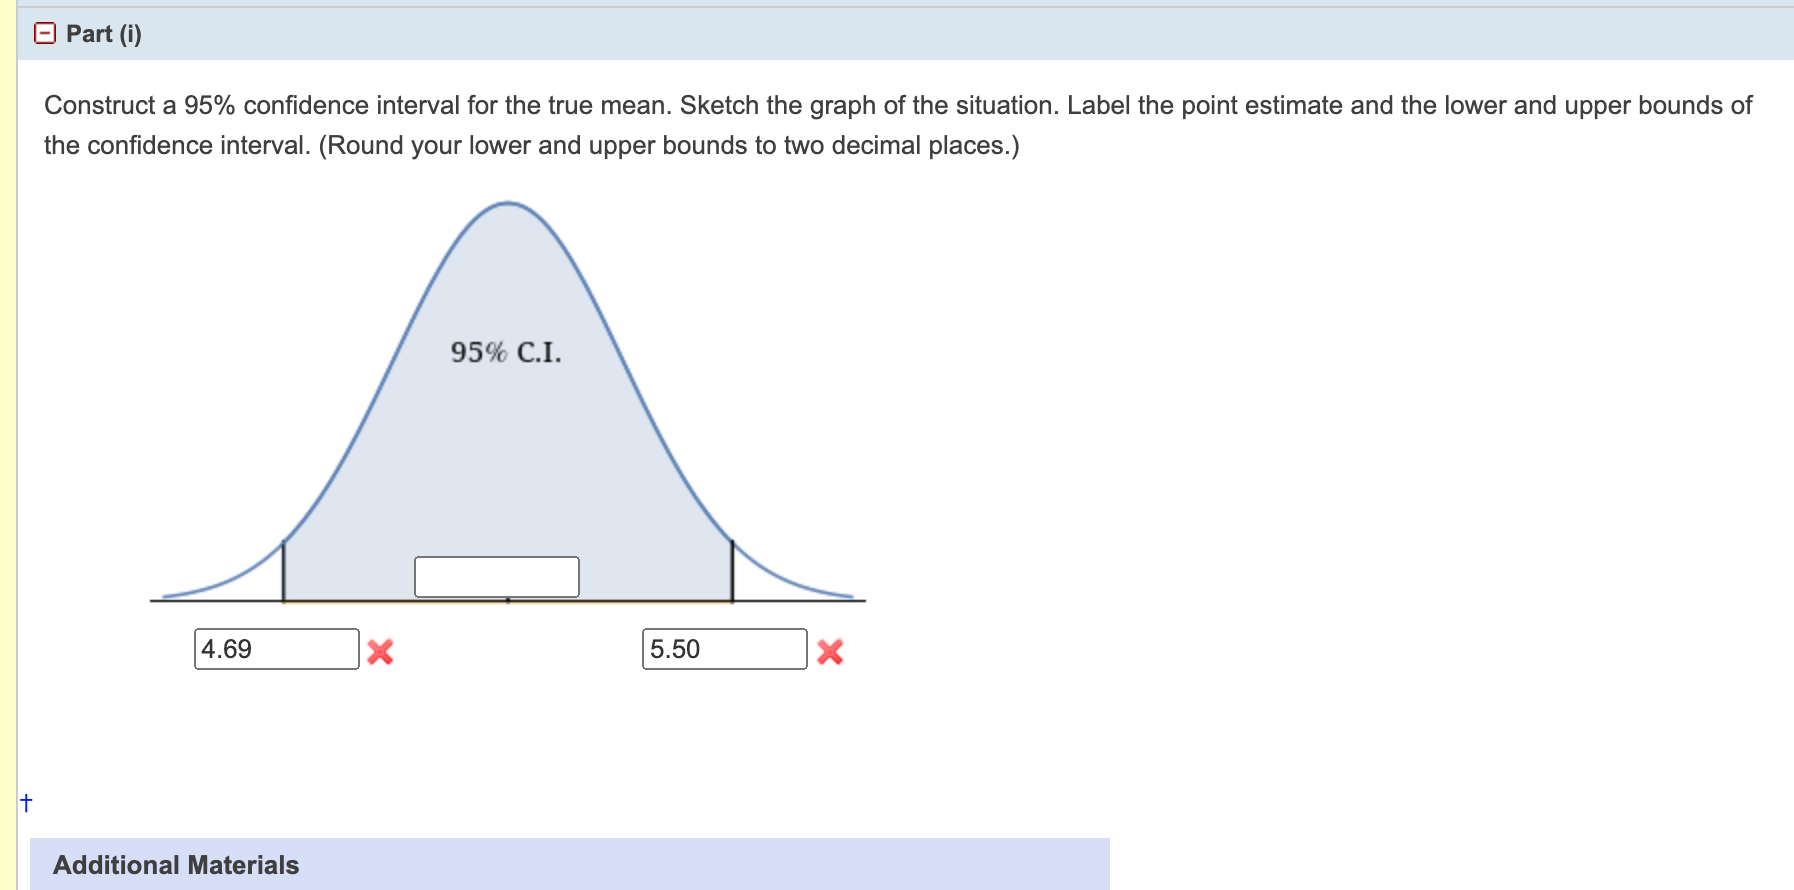
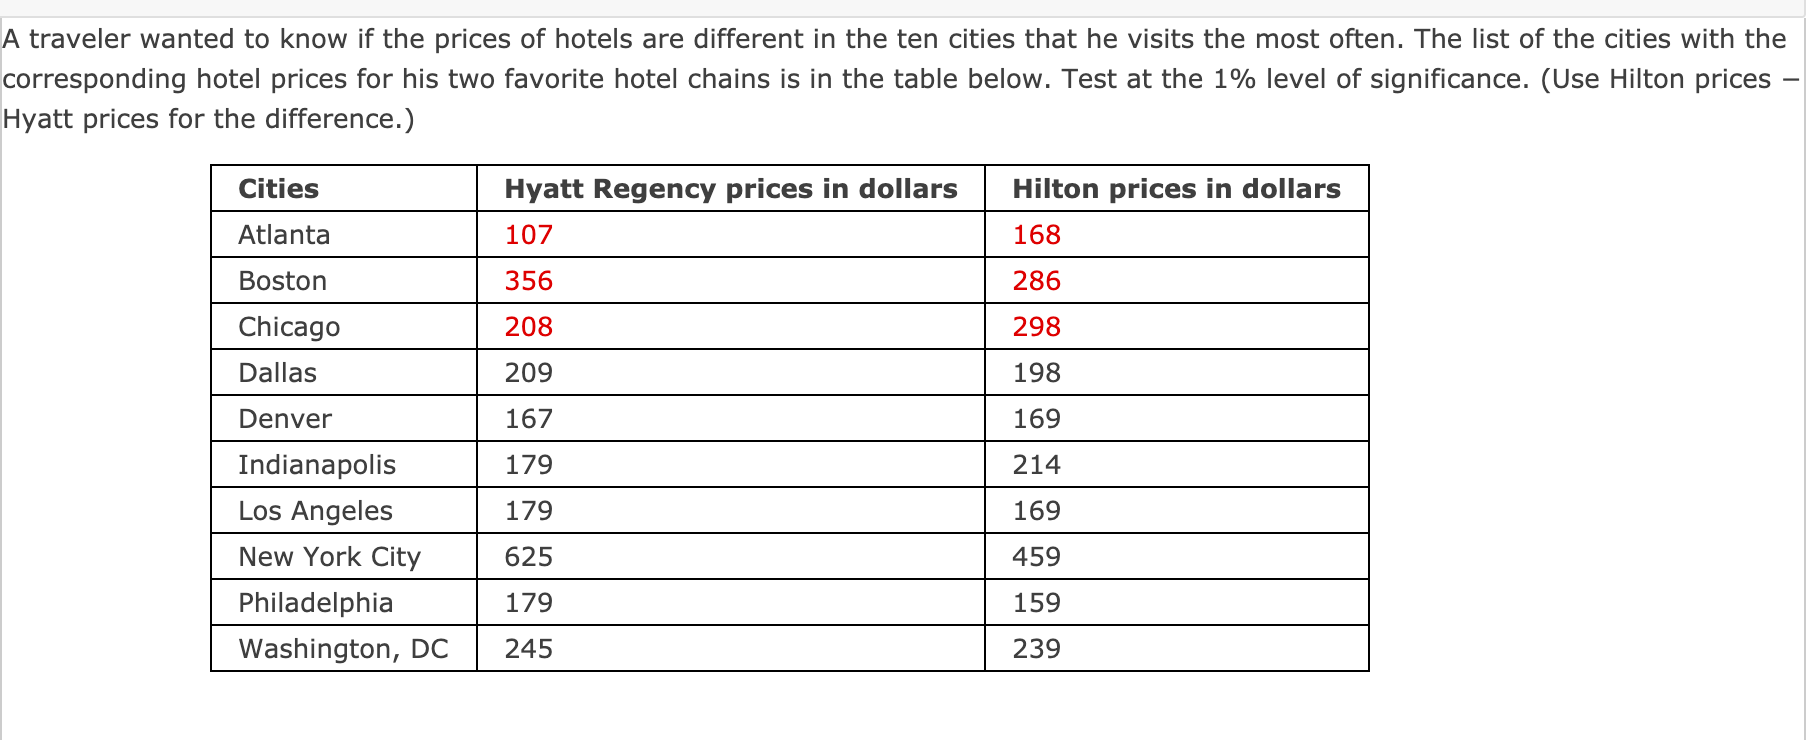
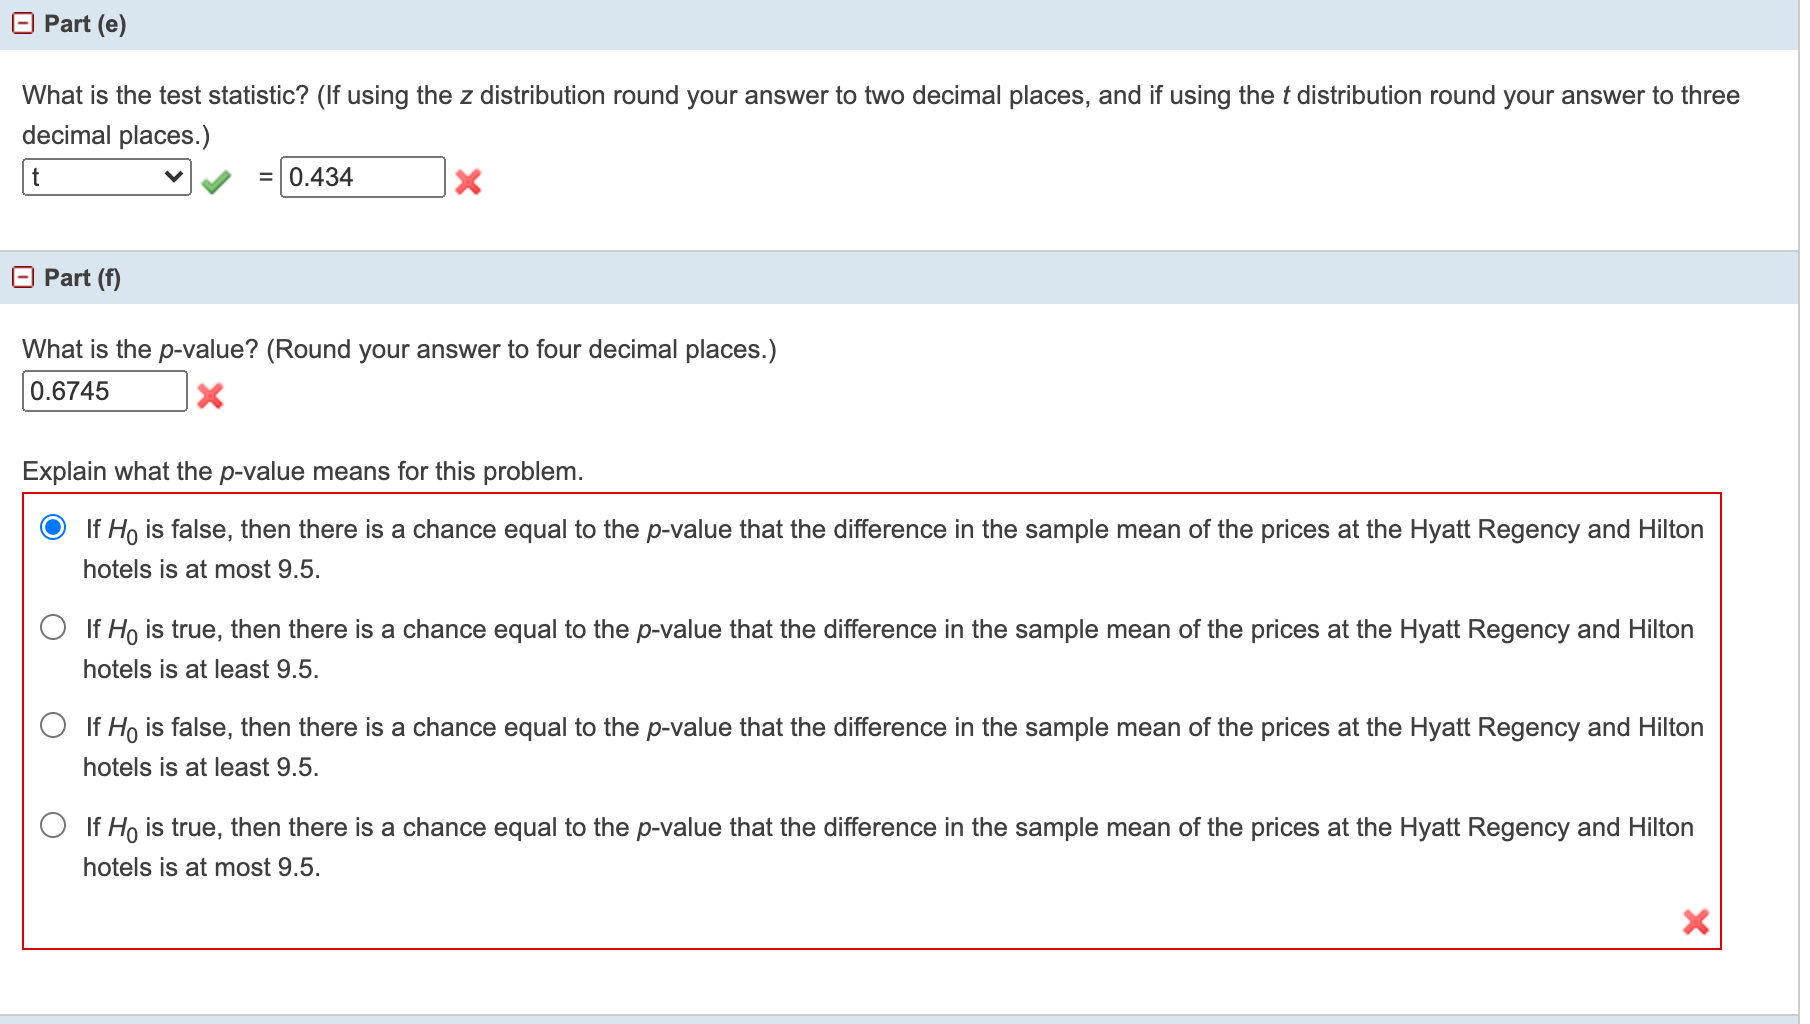
An article in the San Jose Mercury News stated that students in the California state university system take 4.5 years, on average, to finish their undergraduate degrees. Suppose you believe that the mean time is longer. You conduct a survey of 47 students and obtain a sample mean of 5.1 with a sample standard deviation of 1.2. Do the data support your claim at the 1% level? Note: If you are using a Student's t-distribution for the problem, you may assume that the underlying population is normally distributed. (In general, you must first prove that assumption, though.) Part (a) State the null hypothesis. Ho: M 4.5 Ho: #4.5 : > 4.5 Ho: <4.5 Part (d) State the distribution to use for the test. (Enter your answer in the form z or tdf where df is the degrees of freedom.) T 46 Part (e) What is the test statistic? (If using the z distribution round your answers to two decimal places, and if using the t distribution round your answers to three decimal places.) t = 3.438 + Part (i) Construct a 95% confidence interval for the true mean. Sketch the graph of the situation. Label the point estimate and the lower and upper bounds of the confidence interval. (Round your lower and upper bounds to two decimal places.) 95% C.I. 4.69 5.50 Additional Materials A traveler wanted to know if the prices of hotels are different in the ten cities that he visits the most often. The list of the cities with the corresponding hotel prices for his two favorite hotel chains is in the table below. Test at the 1% level of significance. (Use Hilton prices Hyatt prices for the difference.) Cities Hyatt Regency prices in dollars Hilton prices in dollars Atlanta 107 168 Boston 356 286 Chicago 208 298 Dallas 209 198 Denver 167 169 Indianapolis 179 214 Los Angeles 179 169 New York City 625 459 Philadelphia 179 159 Washington, DC 245 239 Part (e) What is the test statistic? (If using the z distribution round your answer to two decimal places, and if using the t distribution round your answer to three decimal places.) t = 0.434 > Part (f) What is the p-value? (Round your answer to four decimal places.) 0.6745 Explain what the p-value means for this problem. If Ho is false, then there is a chance equal to the p-value that the difference in the sample mean of the prices at the Hyatt Regency and Hilton hotels is at most 9.5. If Ho is true, then there is a chance equal to the p-value that the difference in the sample mean of the prices at the Hyatt Regency and Hilton hotels is at least 9.5. If Ho is false, then there is a chance equal to the p-value that the difference in the sample mean of the prices at the Hyatt Regency and Hilton hotels is at least 9.5. If Ho is true, then there is a chance equal to the p-value that the difference in the sample mean of the prices at the Hyatt Regency and Hilton hotels is at most 9.5. An article in the San Jose Mercury News stated that students in the California state university system take 4.5 years, on average, to finish their undergraduate degrees. Suppose you believe that the mean time is longer. You conduct a survey of 47 students and obtain a sample mean of 5.1 with a sample standard deviation of 1.2. Do the data support your claim at the 1% level? Note: If you are using a Student's t-distribution for the problem, you may assume that the underlying population is normally distributed. (In general, you must first prove that assumption, though.) Part (a) State the null hypothesis. Ho: M 4.5 Ho: #4.5 : > 4.5 Ho: <4.5 Part (d) State the distribution to use for the test. (Enter your answer in the form z or tdf where df is the degrees of freedom.) T 46 Part (e) What is the test statistic? (If using the z distribution round your answers to two decimal places, and if using the t distribution round your answers to three decimal places.) t = 3.438 + Part (i) Construct a 95% confidence interval for the true mean. Sketch the graph of the situation. Label the point estimate and the lower and upper bounds of the confidence interval. (Round your lower and upper bounds to two decimal places.) 95% C.I. 4.69 5.50 Additional Materials A traveler wanted to know if the prices of hotels are different in the ten cities that he visits the most often. The list of the cities with the corresponding hotel prices for his two favorite hotel chains is in the table below. Test at the 1% level of significance. (Use Hilton prices Hyatt prices for the difference.) Cities Hyatt Regency prices in dollars Hilton prices in dollars Atlanta 107 168 Boston 356 286 Chicago 208 298 Dallas 209 198 Denver 167 169 Indianapolis 179 214 Los Angeles 179 169 New York City 625 459 Philadelphia 179 159 Washington, DC 245 239 Part (e) What is the test statistic? (If using the z distribution round your answer to two decimal places, and if using the t distribution round your answer to three decimal places.) t = 0.434 > Part (f) What is the p-value? (Round your answer to four decimal places.) 0.6745 Explain what the p-value means for this problem. If Ho is false, then there is a chance equal to the p-value that the difference in the sample mean of the prices at the Hyatt Regency and Hilton hotels is at most 9.5. If Ho is true, then there is a chance equal to the p-value that the difference in the sample mean of the prices at the Hyatt Regency and Hilton hotels is at least 9.5. If Ho is false, then there is a chance equal to the p-value that the difference in the sample mean of the prices at the Hyatt Regency and Hilton hotels is at least 9.5. If Ho is true, then there is a chance equal to the p-value that the difference in the sample mean of the prices at the Hyatt Regency and Hilton hotels is at most 9.5.
Expert Answer:

Related Book For 
Introductory Business Statistics
ISBN: 202318
1st Edition
Authors: Alexander Holmes , Barbara Illowsky , Susan Dean
Posted Date:
Students also viewed these mathematics questions
-
Complete the balance sheet for Company Amri based on the following information. Assume that there are 360 days in a year. Gross profit margin = 38.7% Inventory turnover = 6 times Average collection...
-
An article in the San Jose Mercury News stated that students in the California state university system take 4.5 years, on average, to finish their undergraduate degrees. Suppose you believe that the...
-
1 What are the main components of personal financial planning? Solve What is the purpose of a financial plan? Solve Identify some common actions taken to achieve financial goals. How does a job...
-
Thomas Gilbert and Susan Bradley formed a professional corporation called Financial Services Inc.A Professional Corporation, each taking 50 percent of the authorized common stock. Gilbert is a CPA...
-
Discuss the principle of estoppel and provide examples of how this principle is applied in various situations.
-
You are evaluating the purchase of Cellars, Inc. common stock that just paid a dividend of $1.80. You expect the dividend to grow at a rate of 12% for the next three years. You plan to hold the stock...
-
Assume that the forward rate and spot rate of the Mexican peso are normally similar at a given point in time. Assume that the peso has depreciated consistently and substantially over the last 3...
-
The museum was located in a large city block containing a variety of stores. in late July 1992, a fire that started in one of these stores burned the entire block, including the museum. Fortunately,...
-
Comparative financial statements for Weller Corporation, a merchandising company, for the year ending December 31 appear below. The company did not issue any new common stock during the year. A total...
-
Suppose you are an investor in stock market and you analyze a security on the basis of its fundamentals, following are the returns and their respective market capitalizations of several stocks which...
-
What types of things might an employee do when seeking revenge against an organization? Against a co-worker?
-
The president of Precision Machines wants to convert to TQM. The industrial machinery produced by Precision Machines is critical to customers. If defective machinery is sold to a client, the customer...
-
Wonderful Toy Company (WTC) is celebrating its hundredth anniversary this year. The company has been successful in designing and making educational toys for department stores and smaller specialty...
-
True or false: Employers can read e-mails sent over their computer systems even if employees are not informed of the policy. a. True b. False
-
It has been suggested that stress is in the eyes of the beholder. What does this mean? Do you agree?
-
You are considering the acquisition of a 12,600 square foot industrial building that is fully leased for $0.31 per square foot per month.Market vacancy is 6% and operating expenses total $0.15 per...
-
Rewrite Programming Exercise 7.5 using streams. Display the numbers in increasing order. Data from Programming Exercise 7.5 Write a program that reads in 10 numbers and displays the number of...
-
Three bases of position power are ____________. (a) reward, expertise, and coercive power (b) legitimate, experience, and judgment power (c) knowledge, experience, and judgment power (d) reward,...
-
What are power and influence?
-
What are the key sources of power and influence?

Study smarter with the SolutionInn App