

Question: An assembly line pouring cereal into boxes pulls samples once an hour. In the chart below is the summary of ve boxes that are sampled
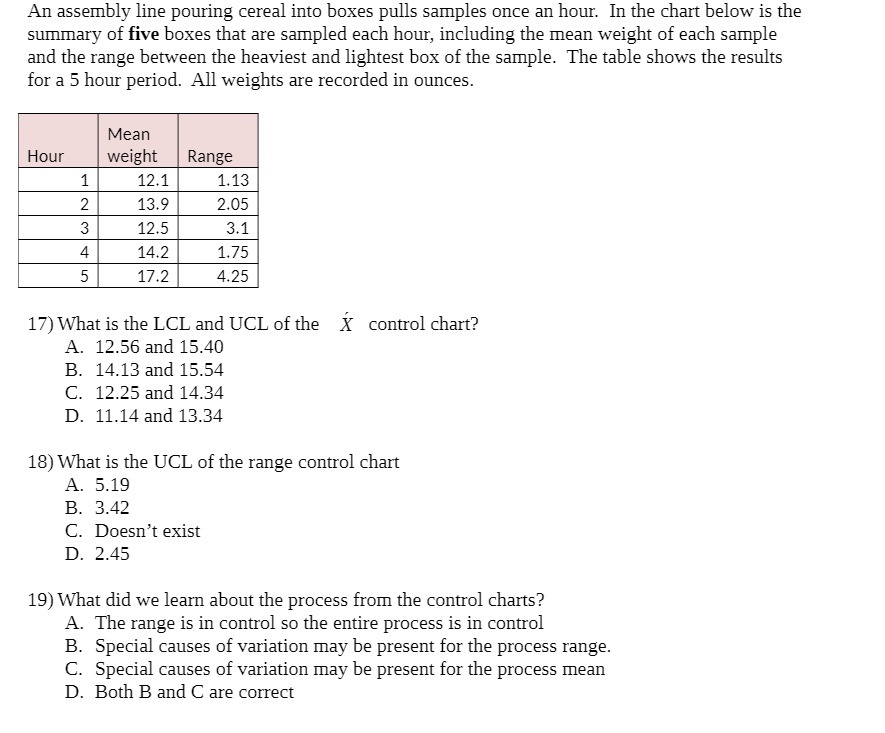
An assembly line pouring cereal into boxes pulls samples once an hour. In the chart below is the summary of ve boxes that are sampled each hour, including the mean weight of each sample and the range between the heaviest and lightest box of the sample. The table shows 1the results for a 5 hour period. All weights are recorded in ounces. 1 . . 2__ 3__ 4 5 17.2 4.25 17) What is the LCL and UCL of the if control chart? A. 12.55 and 15.40 B. 14.13 and 15.54 c. 12.25 and 14.54 D. 11.14 and 13.54 18) What is the UCL of the range control chart A. 5.19 B. 3.42 C. Doesn't exist D. 2.45 19) What did we learn about the process from the control charts? A. The range is in control so the entire process is in control E. Special causes of variation may be present for the process range. (3. Special causes of 1variation may be present for the process mean D. Both B and C are correct
Step by Step Solution
There are 3 Steps involved in it

Get step-by-step solutions from verified subject matter experts