

Question: An educational specialist develops a new teaching technique for a nutrition course. The educational specialist knows that typically scores on a wellvalidated measure of nutrition
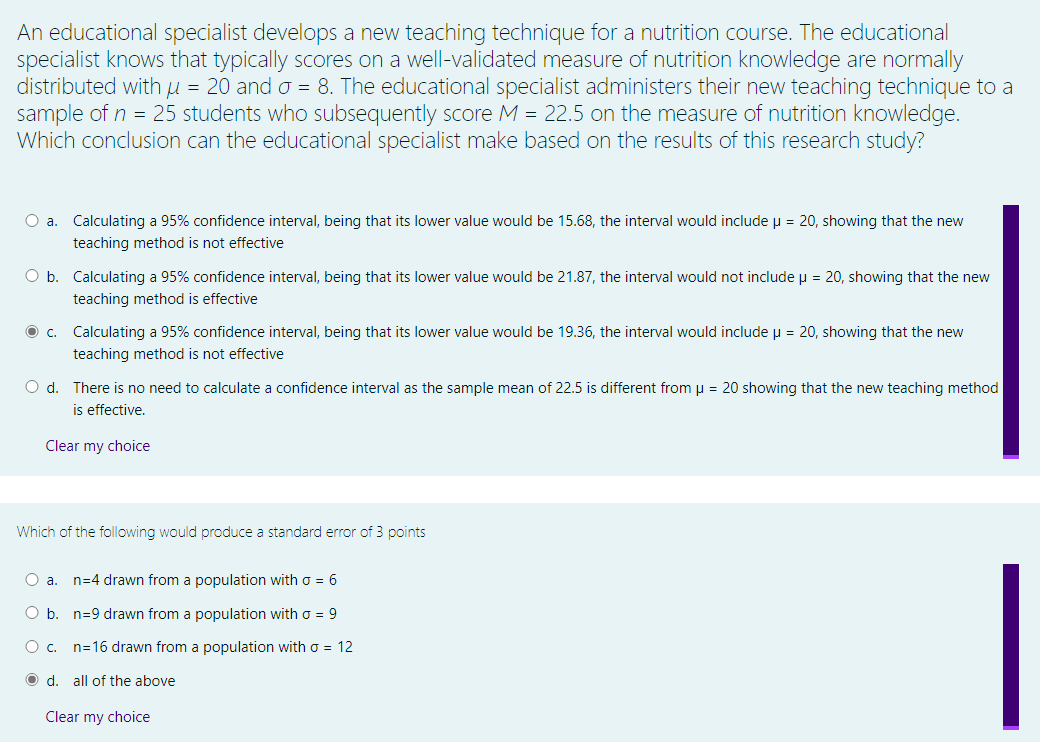
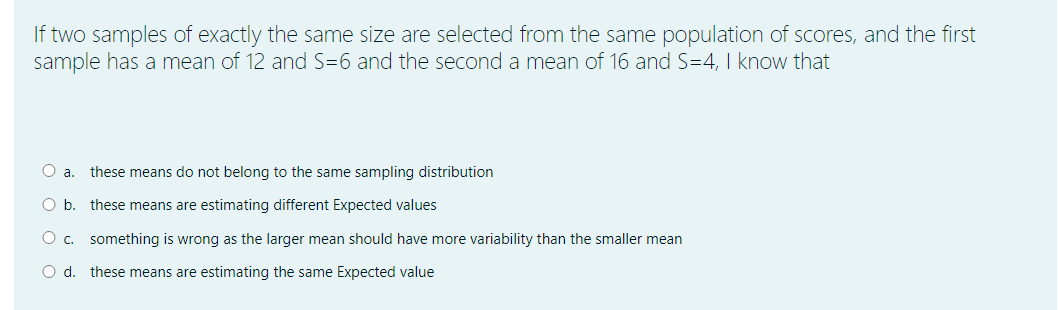
An educational specialist develops a new teaching technique for a nutrition course. The educational specialist knows that typically scores on a wellvalidated measure of nutrition knowledge are normally distributed with ,u = 20 and o = 8. The educational specialist administers their new teaching technique to a sample of n = 25 students who subsequently score M = 22.5 on the measure of nutrition knowledge. Which conclusion can the educational specialist make based on the results of this research study? 0 a. Calculating a 95% confidence interval, being that its lower value would be 15.68, the interval would include u = 20, showing that the new teaching method is not effective 0 b. Calculating a 95% confidence interval, being that its lower value would be 21.87, the interval would not include u = 20, showing that the new teaching method is effective @ c. Calculating a 95% confidence interval, being that its lower value would be 19.36, the interval would include u = 20, showing that the new teaching method is not effective 0 d. There is no need to calculate a confidence interval as the sample mean of 22.5 is different from u = 20 showing that the new teaching method is effective. Clear my choice Which of the following would produce a standard error of 3 points 0 a. n24 drawn from a population with o = 6 O b. n=9 drawn from a population with o = 9 O c. n216 drawn from a population with 0 = 12 @ d. all ofthe above Clear my choice If two samples of exactly the same size are selected from the same population of scores, and the first sample has a mean of 12 and 5:6 and the second a mean of i6 and 524, I know that O a. these means do not belong to the same sampling distribution 0 b. these means are estimating different Expected values 0 c. something is wrong as the larger mean should have more variability than the smaller mean Q d. these means are estimating the same Expected value
Step by Step Solution
There are 3 Steps involved in it

Get step-by-step solutions from verified subject matter experts