

Question: An electric utility is interested in developing a model relating peak hour demand (y in kilowatts) to total monthly energy usage during the month (x,
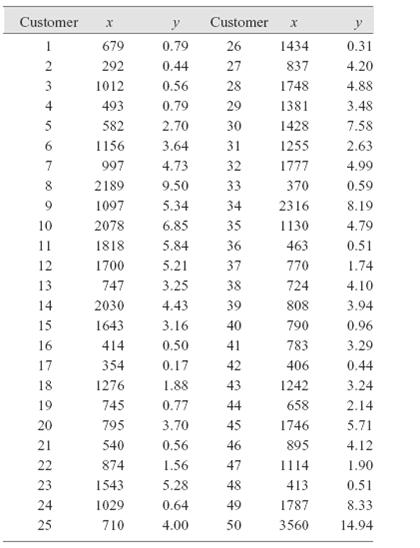
An electric utility is interested in developing a model relating peak hour demand (y in kilowatts) to total monthly energy usage during the month (x, in kilowatt hours). Data for 50 residential customers are shown in the following table.
(a) Draw a scatter diagram of y versus x.
(b) Fit the simple linear regression model.
(c) Test for significance of regression using a = 0.05.
(d) Plot the residuals versus yi and comment on the underlying regression assumptions. Specifically, does it seem that the equality of variance assumption is satisfied?
(e) Find a simple linear regression model using vy as the response. Does this transformation on y stabilize the inequality of variance problem noted in part (d) above?
Step by Step Solution
There are 3 Steps involved in it

Get step-by-step solutions from verified subject matter experts