

Question: An Elementary School Board (ESB) has made the decision to close one of its elementary schools ( 1s Grade, 2nd Grade, and 3rd Grade) at
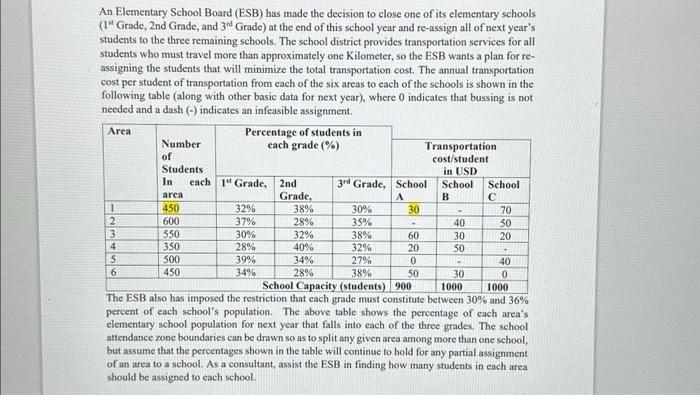
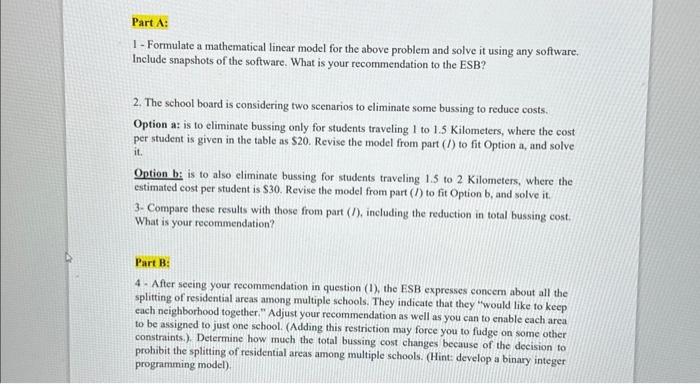
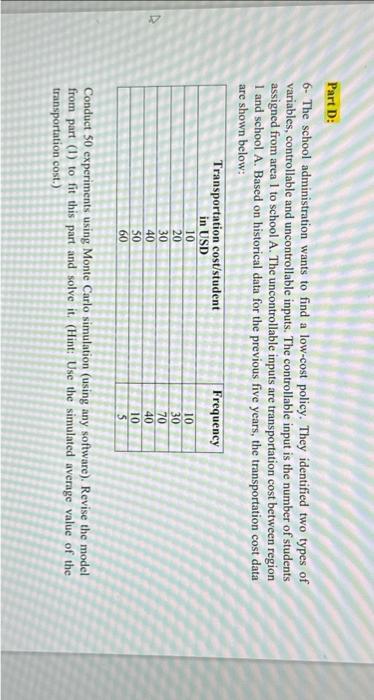
An Elementary School Board (ESB) has made the decision to close one of its elementary schools ( 1s Grade, 2nd Grade, and 3rd Grade) at the end of this school year and re-assign all of next year's students to the three remaining schools. The school district provides transportation services for all students who must travel more than approximately one Kilometer, so the ESB wants a plan for reassigning the students that will minimize the total transportation cost. The annual transportation cost per student of transportation from each of the six areas to each of the schools is shown in the following table (along with other basic data for next year), where 0 indicates that bussing is not needed and a dash () indicates an infeasible assignment. The ESB also has imposed the restriction that each grade must constitute between 30% and 36% percent of each school's population. The above table shows the percentage of each area's elementary school population for next year that falls into each of the three grades. The school attendance zone boundaries can be drawn so as to split any given area among more than one school, but assume that the percentages shown in the table will continue to hold for any partial assignment of an area to a school. As a consultant, assist the ESB in finding how many students in each area should be assigned to each school. Part A: 1- Formulate a mathematical linear model for the above problem and solve it using any software, Include snapshots of the software. What is your recommendation to the ESB? 2. The school board is considering two scenarios to eliminate some bussing to reduce costs. Option a: is to eliminate bussing only for students traveling 1 to 1.5 Kilometers, where the cost per student is given in the table as $20. Revise the model from part (I) to fit Option a, and solve it. Option b: is to also eliminate bussing for students traveling 1.5 to 2 Kilometers, where the estimated cost per student is $30. Revise the model from part (I) to fit Option b, and solve it. 3- Compare these results with those from part ( / ), including the reduction in total bussing cost. What is your recommendation? Part B: 4. After seeing your recommendation in question (1), the ESB expresses concem about all the splitting of residential areas among multiple schools. They indicate that they "would like to keep each neighborhood together." Adjust your recommendation as well as you can to enable each area to be assigned to just one school. (Adding this restriction may force you to fudge on some other constraints.). Determine how much the total bussing cost changes because of the decision to prohibit the splitting of residential areas among multiple schools. (Hint: develop a binary integer programming model). 5- Use queuing theory approach to determine the number of buses required to pick up students from area 1 to school A. Assume the capacity of a bus is 50 students (Hint: max number of buses is 450/50=9 ) and a bus is allowed to take only one shift/trip. The bus will not move until it is full. The school administration estimates the cost of student waiting time for the bus is $50 per hour and the service cost for a bus is $60 per hour. Assume the students are picked up at an average rate of 30 per hour and they arrive at the bus station at an average of 25 per hour. Assume the pick-up process is for one hour (6:00 am- 7:00 am). Calculate the total cost for each scenario and select the best scenario. 6- The school administration wants to find a low-cost policy. They identified two types of variables, controllable and uncontrollable inputs. The controllable input is the number of students assigned from area 1 to school A. The uncontrollable inputs are transportation cost between region 1 and school A. Based on historical data for the previous five years, the transportation cost data are shown below: Conduct 50 experiments using Monte Carlo simulation (using any software). Revise the model from part (1) to fit this part and solve it. (Hint: Use the simulated average value of the transportation cost.)
Step by Step Solution
There are 3 Steps involved in it

Get step-by-step solutions from verified subject matter experts