

Question: Fitting a linear trend to 36 monthly data points (January 2000= 1, February 2000 -2, March 2000= 3, etc.) produced the following tables. Intercept
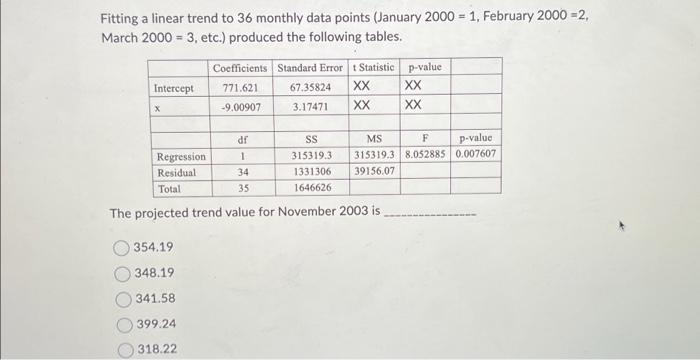
Fitting a linear trend to 36 monthly data points (January 2000= 1, February 2000 -2, March 2000= 3, etc.) produced the following tables. Intercept x Coefficients Standard Errort Statistic 771.621 67.35824 XX -9.00907 3.17471 XX 354.19 348.19 341.58 399.24 318.22 p-value XX XX df SS MS F 1 315319.3 315319.3 8.052885 Regression Residual 34 1331306 39156.07 Total 35 1646626 The projected trend value for November 2003 is p-value 0.007607
Step by Step Solution
3.42 Rating (149 Votes )
There are 3 Steps involved in it
Solutions The x value for November 2003 ... View full answer

Get step-by-step solutions from verified subject matter experts