

Question: An Excel file containing the data for Question 1 has been uploaded to the Assignments folder on Moodle. The file is called Data_Q1. The data
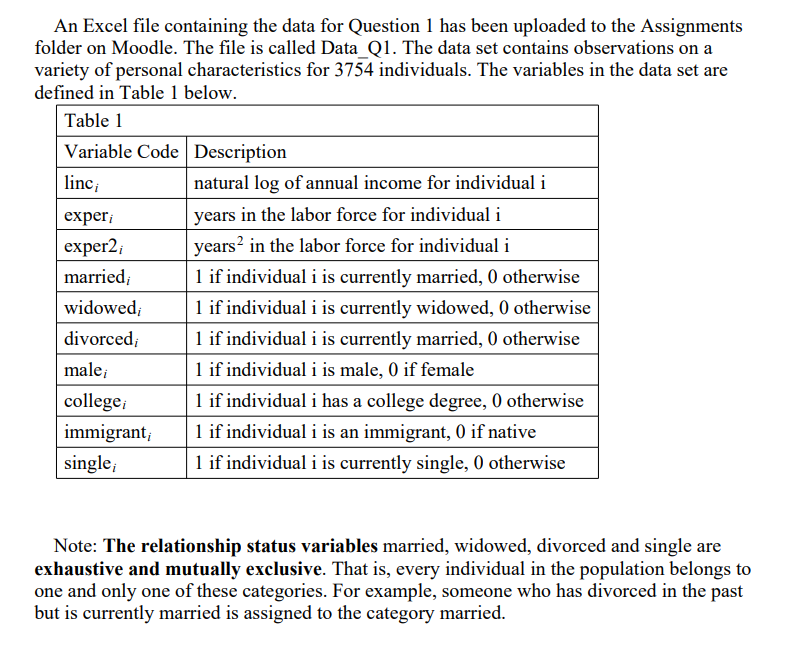
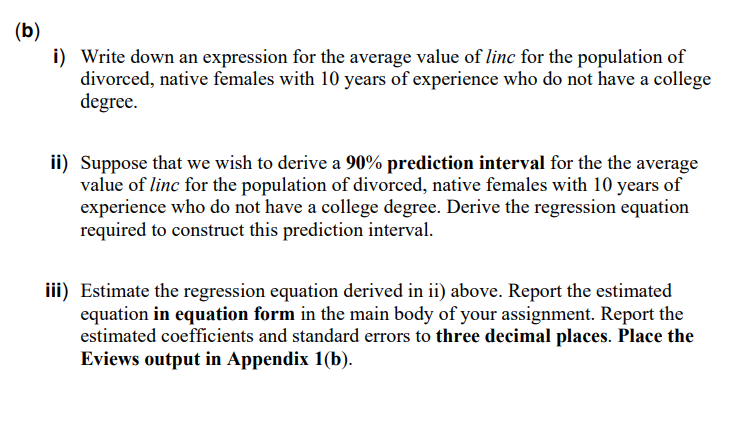
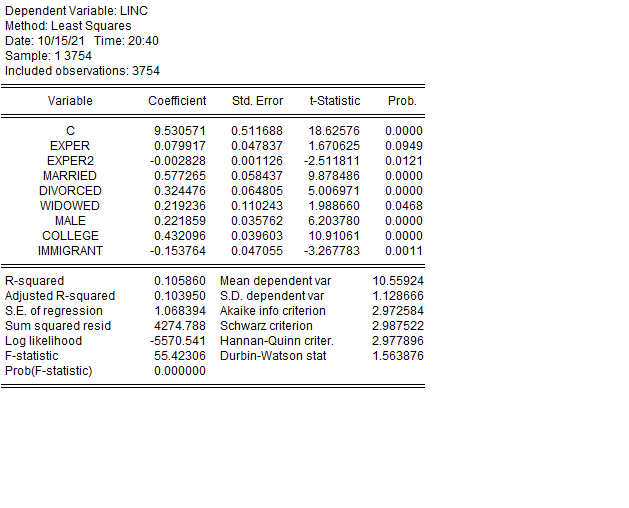
An Excel file containing the data for Question 1 has been uploaded to the Assignments folder on Moodle. The file is called Data_Q1. The data set contains observations on a variety of personal characteristics for 3754 individuals. The variables in the data set are defined in Table 1 below. Table 1 Variable Code | Description linc natural log of annual income for individual i experi years in the labor force for individual i exper2; years in the labor force for individual i married 1 if individual i is currently married, 0 otherwise widowed; 1 if individual i is currently widowed, 0 otherwise divorced; 1 if individual i is currently married, 0 otherwise male; 1 if individual i is male, 0 if female college; 1 if individual i has a college degree, 0 otherwise immigrant; 1 if individual i is an immigrant, 0 if native single; 1 if individual i is currently single, 0 otherwise Note: The relationship status variables married, widowed, divorced and single are exhaustive and mutually exclusive. That is, every individual in the population belongs to one and only one of these categories. For example, someone who has divorced in the past but is currently married is assigned to the category married.(b) i) II) III) Write down an expression for the average value of Linc for the population of divorced, native females with 1!] years of experience who do not have a college degree. Suppose that we wish to derive a 910% prediction interval for the the average value of fine for the population of divorced, native females with 1!} years of experience who do not have a college degree. Derive the regression equation required to construct this prediction interval. Estimate the regression equation derived in ii) above. Report the estimated equation in equation form in the main bod},r ofyour assignment. Report the estimated coefcients and standard errors to three decimal places. Place the Eviews output in Appendix 10:). Dependent Variable: LINC Method: Least Squares Date: 10/15/21 Time: 20:40 Sample: 1 3754 Included observations: 3754 Variable Coefficient Std. Error t-Statistic Prob. C 9.530571 0.511688 18.62576 0.0000 EXPER 0.079917 0.047837 1.670625 0.0949 EXPER2 -0.002828 0.001126 -2.511811 0.0121 MARRIED 0.577265 0.058437 9.878486 0.0000 DIVORCED 0.324476 0.064805 5.006971 0.0000 WIDOWED 0.219236 0.110243 1.988660 0.0468 MALE 0.221859 0.035762 6.203780 0.0000 COLLEGE 0.432096 0.039603 10.91061 0.0000 IMMIGRANT -0.153764 0.047055 -3.267783 0.0011 R-squared 0. 105860 Mean dependent var 10.55924 Adjusted R-squared 0.103950 S.D. dependent var 1.128666 S.E. of regression 1.068394 Akaike info criterion 2.972584 Sum squared resid 4274.788 Schwarz criterion 2.987522 Log likelihood -5570.541 Hannan-Quinn criter. 2.977896 F-statistic 55.42306 Durbin-Watson stat 1.563876 Prob(F-statistic) 0.000000
Step by Step Solution
There are 3 Steps involved in it

Get step-by-step solutions from verified subject matter experts