

Question: An experiment for smaller - the - better using an L 1 6 array produced the following response table results. If the overall experimental average
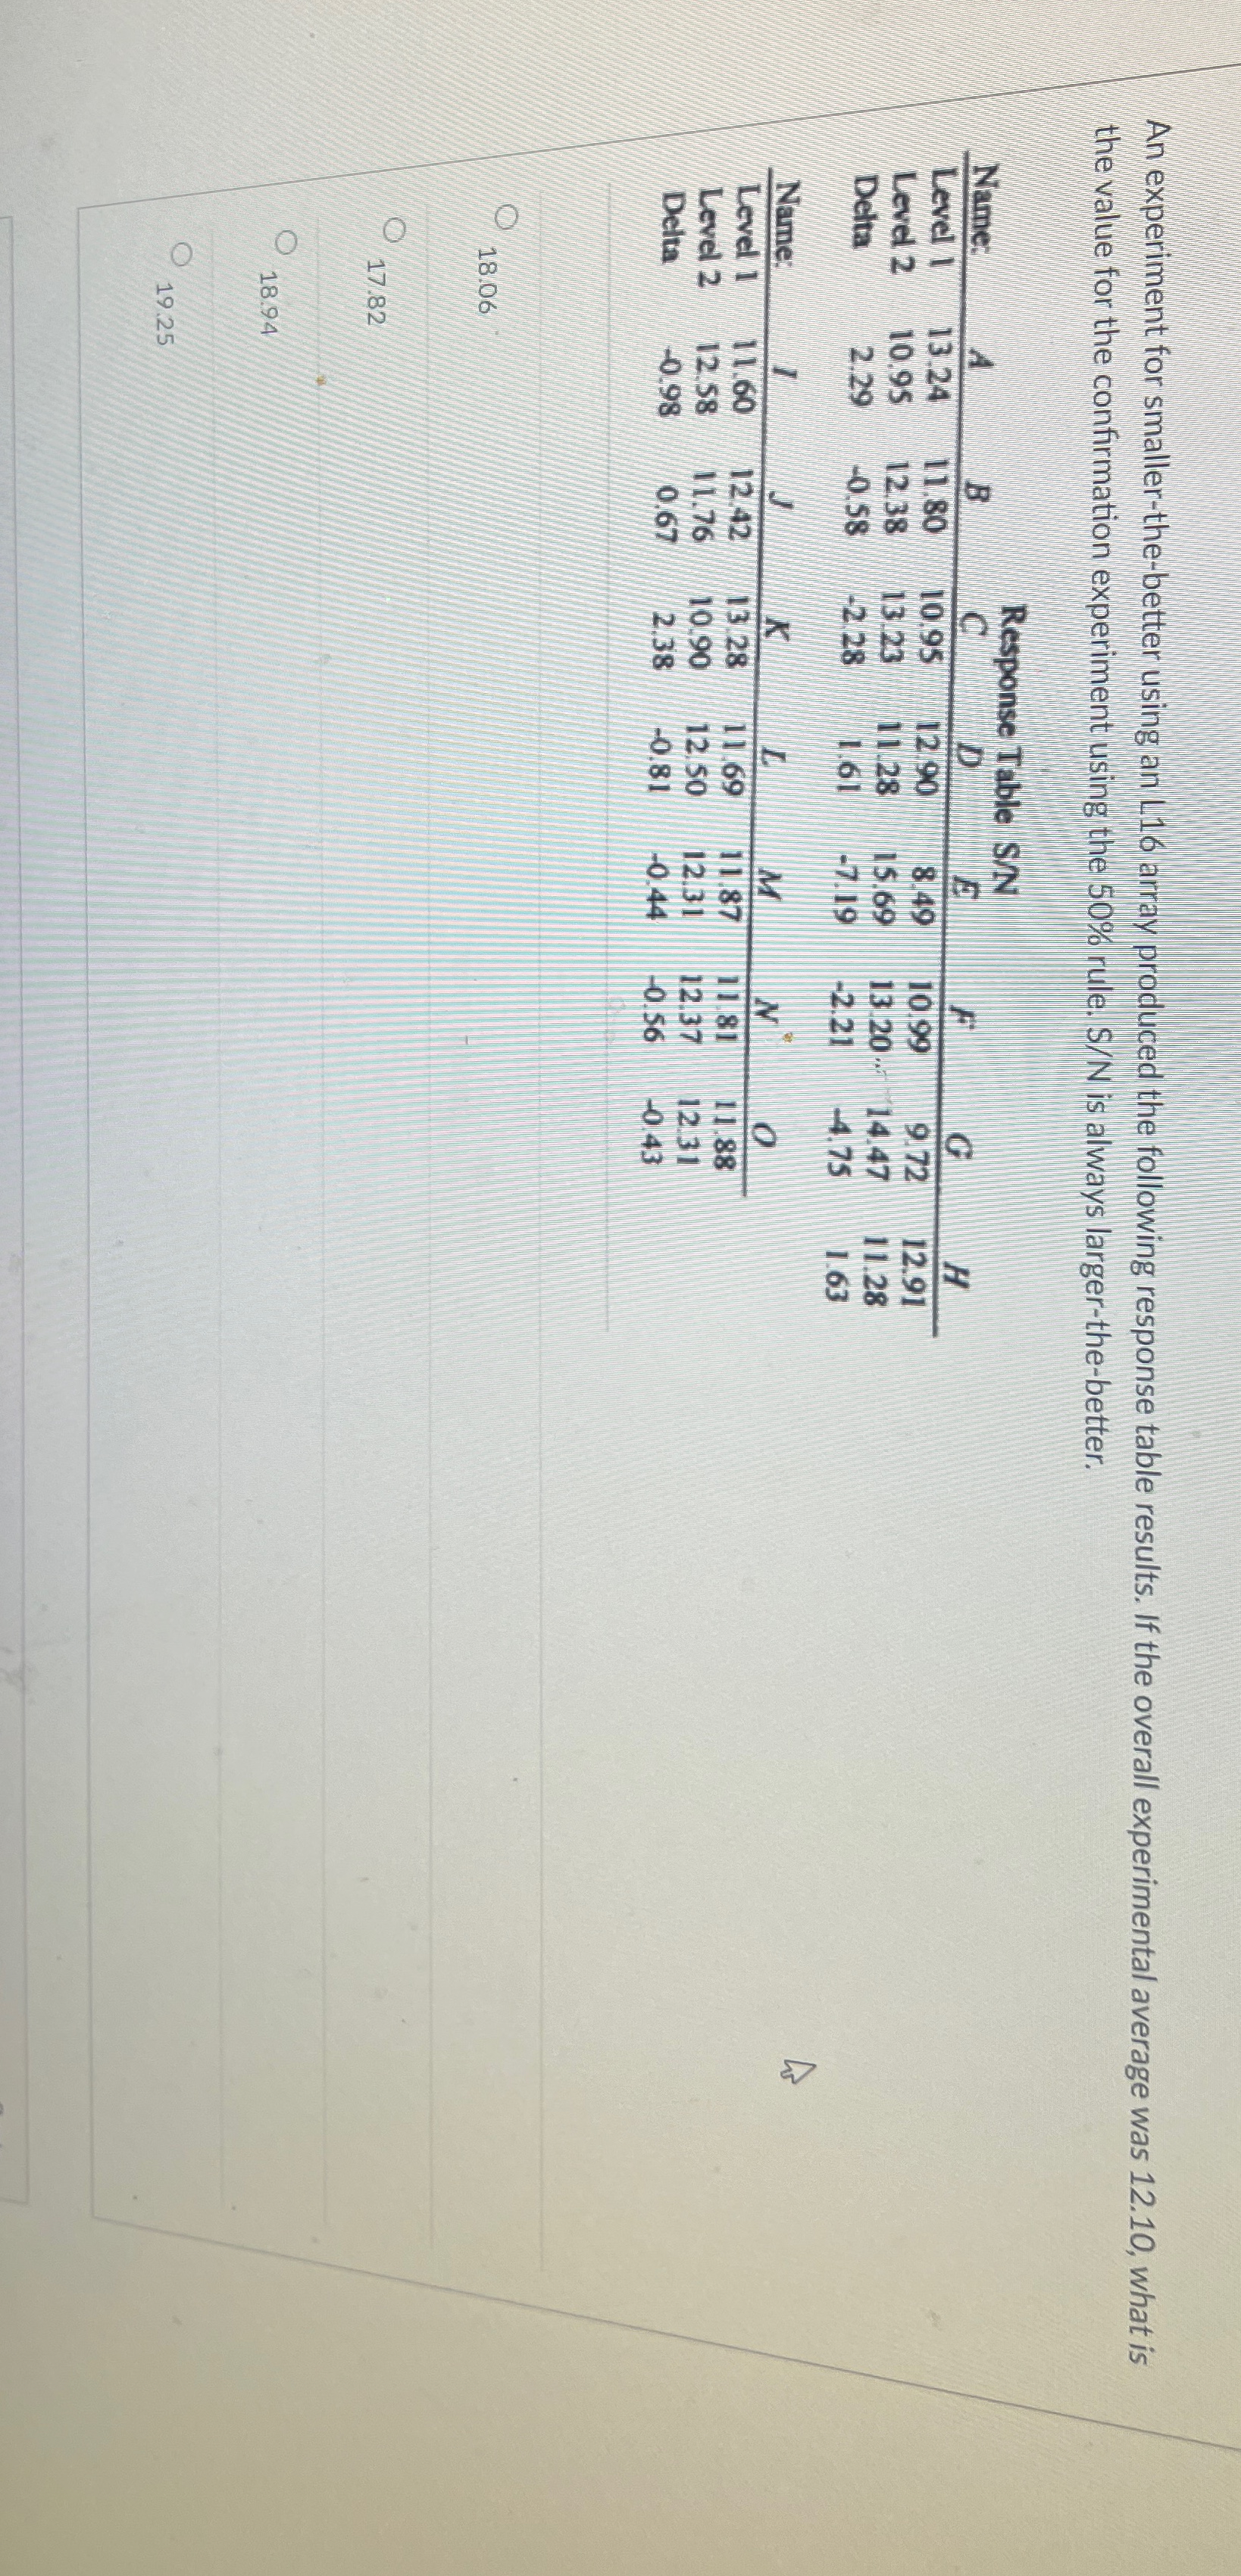
An experiment for smallerthebetter using an L array produced the following response table results. If the overall experimental average was what is the value for the confirmation experiment using the rule. SN is always largerthebetter.
tableResp,se VName:ABCDGHLevel I,Level Delta
tableName:I,
Step by Step Solution
There are 3 Steps involved in it
1 Expert Approved Answer
Step: 1 Unlock

Question Has Been Solved by an Expert!
Get step-by-step solutions from verified subject matter experts
Step: 2 Unlock
Step: 3 Unlock