

Question: An input step test was conducted on a process where the heating rate was increased from 5 kW to 11 kW, and the resulting temperature
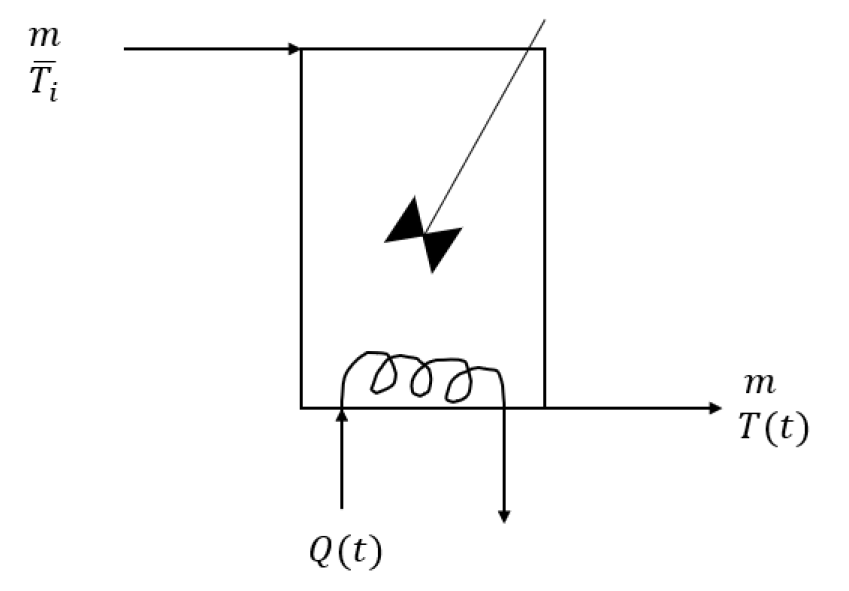
An input step test was conducted on a process where the heating rate was increased from 5 kW to 11 kW, and the resulting temperature response was recorded at different time intervals. The recorded temperature data is given in a table. The task is to plot the temperature response curve and determine the process gain, process time constant, and process time delay from the data either by inspection or using Solver. Finally, we are asked to find the transfer function of the process using these process parameters. Assumptions: volume of the tank and density of the liquid is held constant, specific heat capacity of the liquid is constant, tank is perfectly mixed, no heat losses.
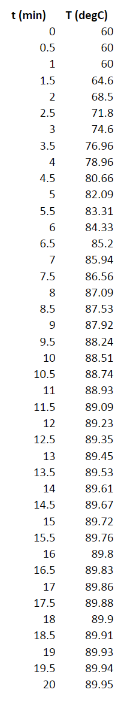
t(min)00.511.522.533.544.555.566.577.588.599.510.51919.520T(degC)60606064.668.571.874.676.9678.9680.6682.0983.3184.3385.285.9486.5687.0987.5387.9288.2489.9189.9389.9489.95 Tim t(min)00.511.522.533.544.555.566.577.588.599.510.51919.520T(degC)60606064.668.571.874.676.9678.9680.6682.0983.3184.3385.285.9486.5687.0987.5387.9288.2489.9189.9389.9489.95 Tim
Step by Step Solution
There are 3 Steps involved in it

Get step-by-step solutions from verified subject matter experts