

Question: An intern hands you a spreadsheet with sales data for trucks over the past 10 weeks. They want to ensure the forecast is responsive to
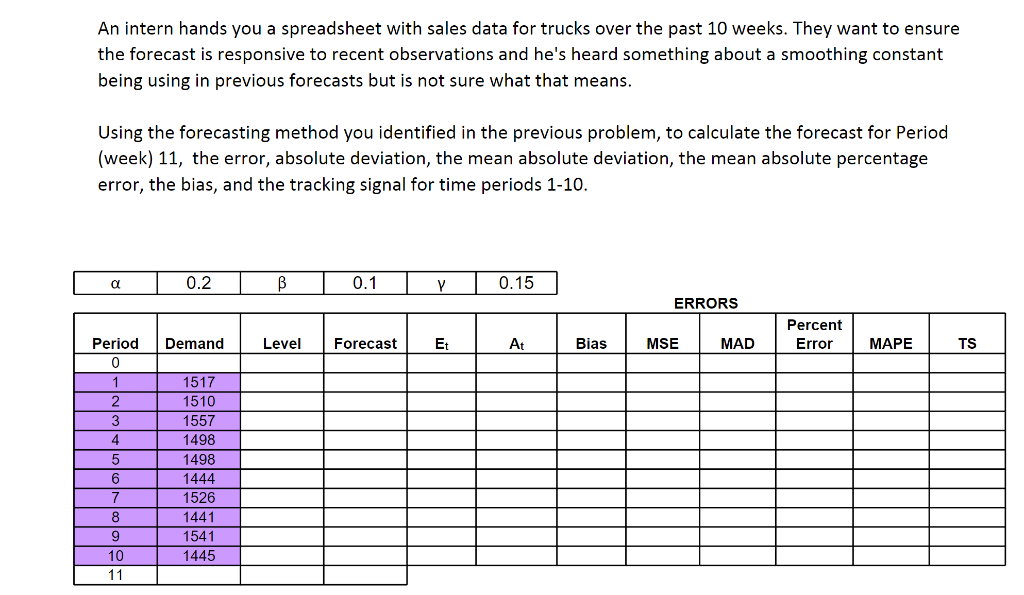
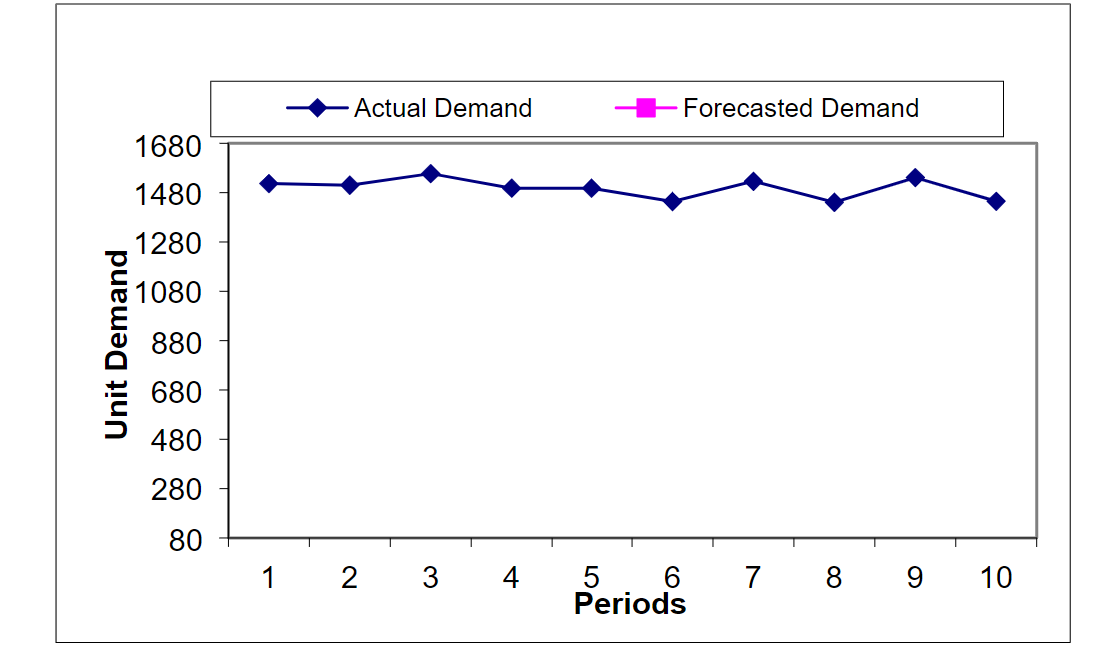
An intern hands you a spreadsheet with sales data for trucks over the past 10 weeks. They want to ensure the forecast is responsive to recent observations and he's heard something about a smoothing constant being using in previous forecasts but is not sure what that means. Using the forecasting method you identified in the previous problem, to calculate the forecast for Period (week) 11, the error, absolute deviation, the mean absolute deviation, the mean absolute percentage error, the bias, and the tracking signal for time periods 1-10. a 0.2 B 0.1 0.15 ERRORS Demand Percent Error Level Forecast E Et At Bias MSE MAD MAPE TS 1517 1510 Period 0 1 2 3 4 5 6 7 8 9 10 11 1557 1498 1498 1444 1526 1441 1541 1445 Actual Demand Forecasted Demand 1680 1480 1280 1080 Unit Demand 880 680 480 280 80 1 2 3 4 5 6 Periods 7 8 9 10 An intern hands you a spreadsheet with sales data for trucks over the past 10 weeks. They want to ensure the forecast is responsive to recent observations and he's heard something about a smoothing constant being using in previous forecasts but is not sure what that means. Using the forecasting method you identified in the previous problem, to calculate the forecast for Period (week) 11, the error, absolute deviation, the mean absolute deviation, the mean absolute percentage error, the bias, and the tracking signal for time periods 1-10. a 0.2 B 0.1 0.15 ERRORS Demand Percent Error Level Forecast E Et At Bias MSE MAD MAPE TS 1517 1510 Period 0 1 2 3 4 5 6 7 8 9 10 11 1557 1498 1498 1444 1526 1441 1541 1445 Actual Demand Forecasted Demand 1680 1480 1280 1080 Unit Demand 880 680 480 280 80 1 2 3 4 5 6 Periods 7 8 9 10
Step by Step Solution
There are 3 Steps involved in it

Get step-by-step solutions from verified subject matter experts