

Question: An NPV profile plots a project's NPV at various costs of capital, tabeled A and B* in the graph. A project's NPV profle is shown
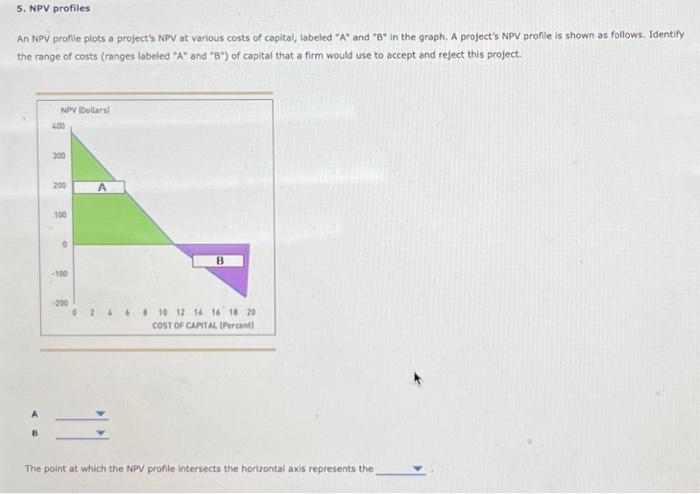
An NPV profile plots a project's NPV at various costs of capital, tabeled "A" and "B* in the graph. A project's NPV profle is shown as follows. Identify the range of costs (ranges labeled "A" and " B ") of capital that a firm would use to accept and reject this project. A. B The point at which the NPV profile intersects the horizontal axis represents the An NPV profile plots a project's NPV at various costs of capital, tabeled "A" and "B* in the graph. A project's NPV profle is shown as follows. Identify the range of costs (ranges labeled "A" and " B ") of capital that a firm would use to accept and reject this project. A. B The point at which the NPV profile intersects the horizontal axis represents the
Step by Step Solution
There are 3 Steps involved in it

Get step-by-step solutions from verified subject matter experts