

Question: An object is in motion, and its position is recorded every 2 seconds. Create a graph of the following data that was collected. Note:
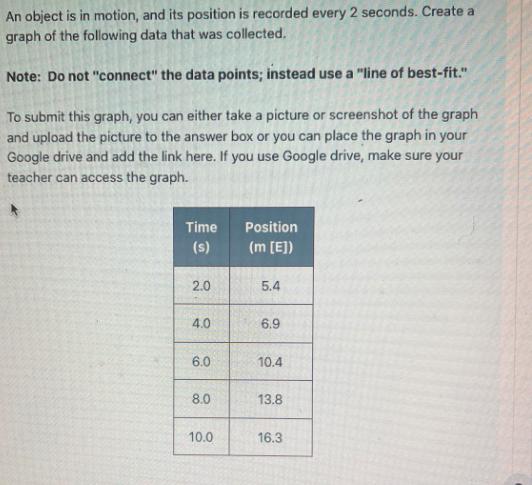
An object is in motion, and its position is recorded every 2 seconds. Create a graph of the following data that was collected. Note: Do not "connect" the data points; instead use a "line of best-fit." To submit this graph, you can either take a picture or screenshot of the graph and upload the picture to the answer box or you can place the graph in your Google drive and add the link here. If you use Google drive, make sure your teacher can access the graph. Time Position (s) (m [E]) 2.0 5.4 4.0 6.9 6.0 10.4 8.0 13.8 10.0 16.3
Step by Step Solution
3.48 Rating (161 Votes )
There are 3 Steps involved in it
18 16 14 12 10 J 41 2 0 0 ponoto WI ... View full answer

Get step-by-step solutions from verified subject matter experts