Question: an Ocean Carriers Case Study.pdf X + X C File | C:/Users/Elise%20Perrow/OneDrive/Desktop/Ocean%20Carriers%20Case%20Study.pdf Draw | | A | at> | Ask Copilot + 2 hire rates
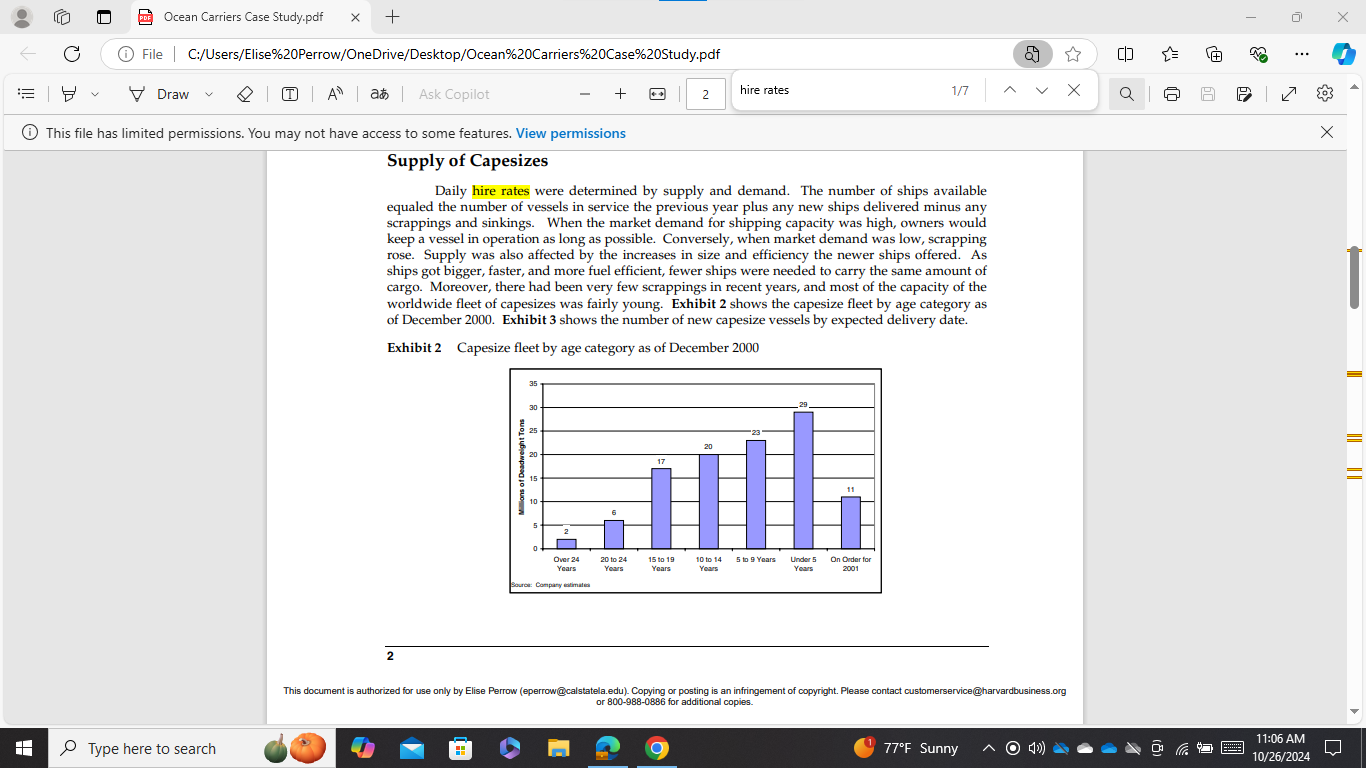
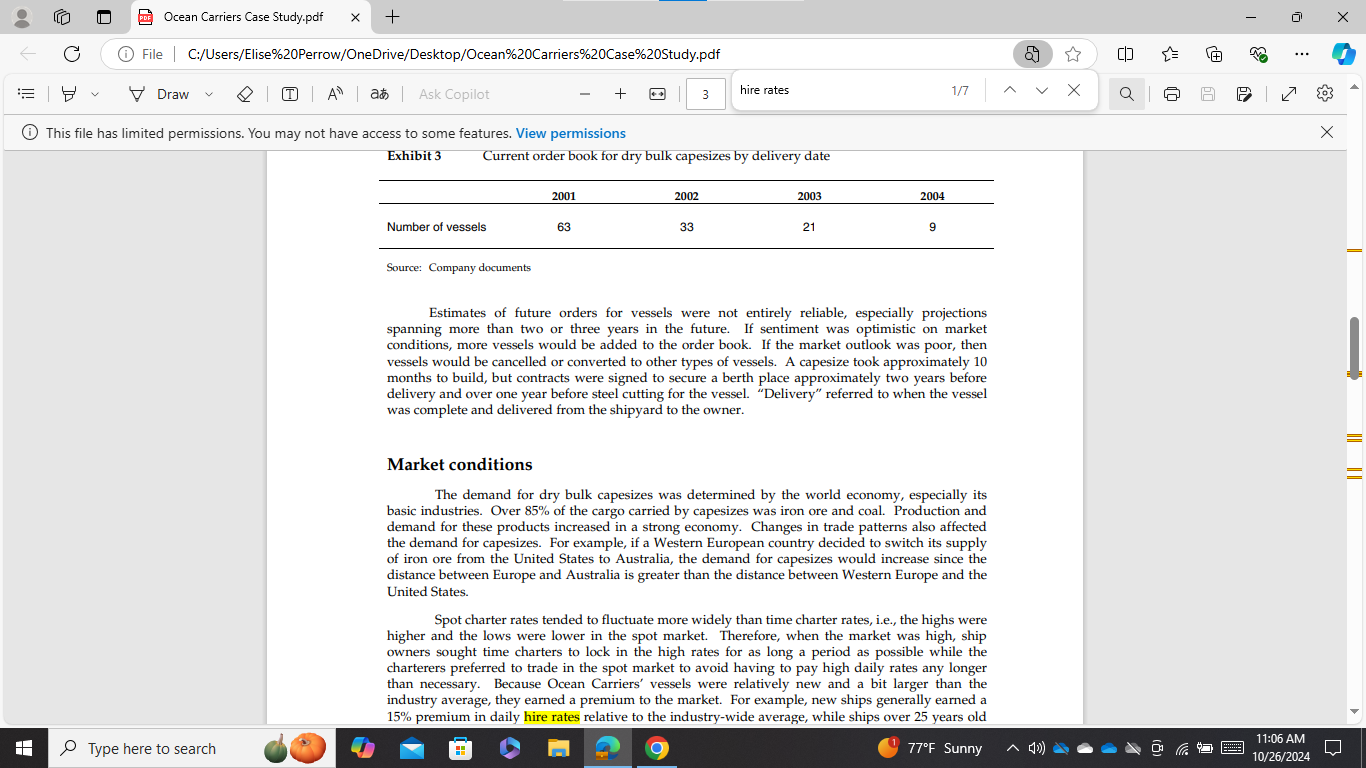
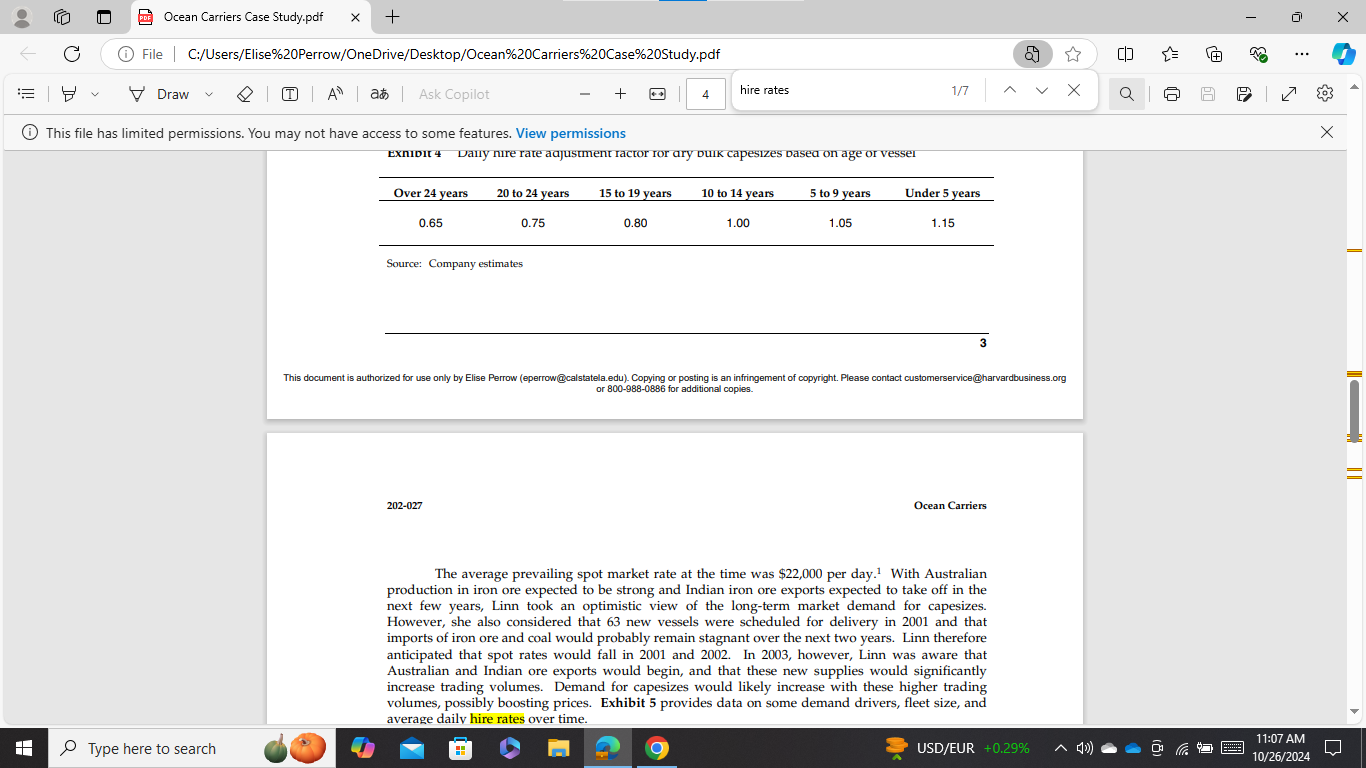
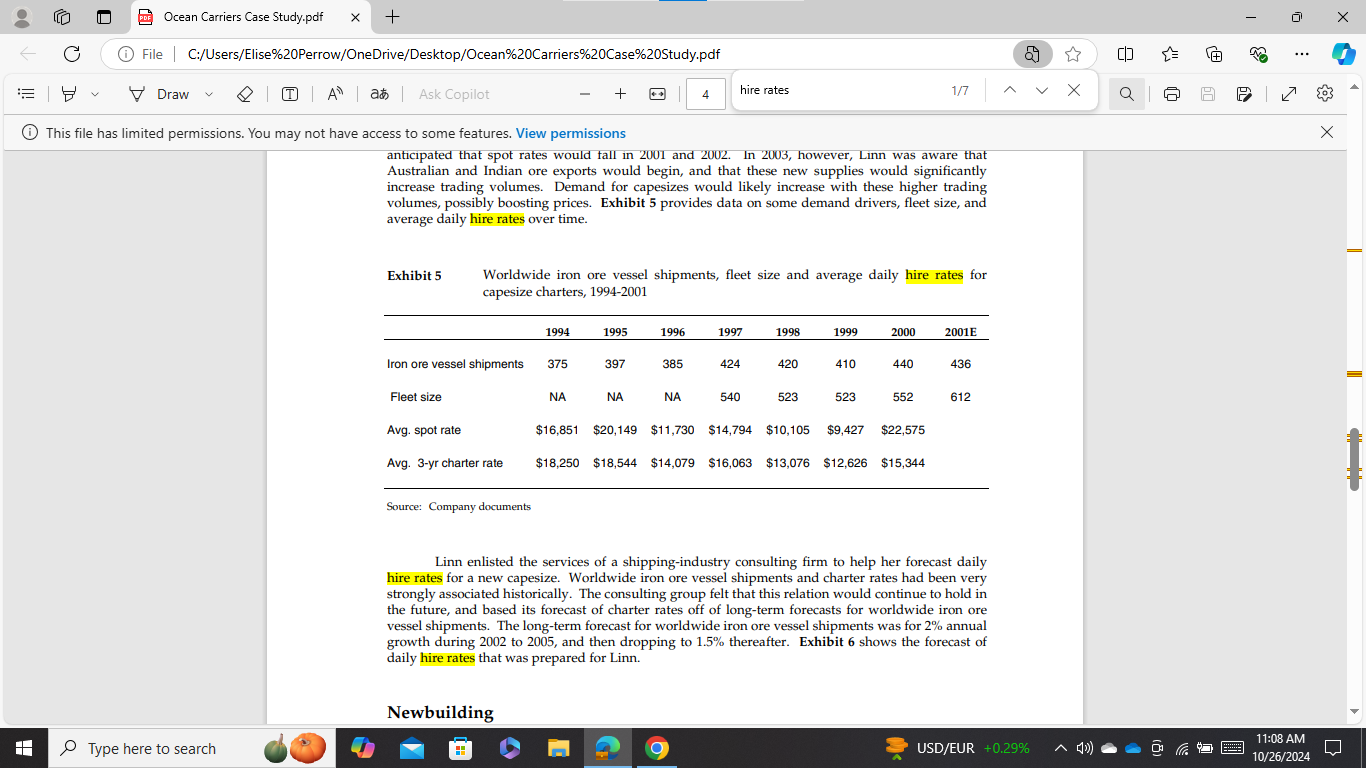
an Ocean Carriers Case Study.pdf X + X C File | C:/Users/Elise%20Perrow/OneDrive/Desktop/Ocean%20Carriers%20Case%20Study.pdf Draw | | A | at> | Ask Copilot + 2 hire rates 1/7 V X Q P This file has limited permissions. You may not have access to some features. View permissions X Supply of Capesizes Daily hire rates were determined by supply and demand. The number of ships available equaled the number of vessels in service the previous year plus any new ships delivered minus any scrappings and sinkings. When the market demand for shipping capacity was high, owners would keep a vessel in operation as long as possible. Conversely, when market demand was low, scrapping rose. Supply was also affected by the increases in size and efficiency the newer ships offered. As ships got bigger, faster, and more fuel efficient, fewer ships were needed to carry the same amount of cargo. Moreover, there had been very few scrappings in recent years, and most of the capacity of the worldwide fleet of capesizes was fairly young. Exhibit 2 shows the capesize fleet by age category as of December 2000. Exhibit 3 shows the number of new capesize vessels by expected delivery date. Exhibit 2 Capesize fleet by age category as of December 2000 35 20 17 Motions of Deadweight Tons Over 24 20 to 24 15 to 19 10 to 14 5 to 9 Years Under 5 On Order for Years Yours Years Years Yours 2001 roi: Company estimates 2 This document is authorized for use only by Elise Perrow (eperrow@ calstatela.edu). Copying or posting is an infringement of copyright. Please contact customerservice @harvardbusiness.org or 800-988-0886 for additional copies. Type here to search 77'F Sunny ^0()9718 11:06 AM 10/26/2024z @ 0 @ Ocean Carriers Case Study.pdf X + - o G '::' File | C:/Users/Elise%20Perrow/OneDrive/Desktop/Ocean%20Carriers%20Case%205tudy.pdf 53 7 [D { % 9 = \\5.0 & %/ Draw ~ Q A a# L 4+ = 3 hire rates 147 ~ v X [k =l 2 7 g?,'g ~ @ This file has limited permissions. You may not have access to some features. View permissions X Exhibit 3 Current order book for dry bulk capesizes by delivery date 2001 2002 2003 2004 Number of vessels 63 33 21 9 Source: Company documents Estimates of future orders for vessels were not entirely reliable, especially projections spanning more than two or three years in the future. If sentiment was optimistic on market conditions, more vessels would be added to the order book. If the market outlook was poor, then vessels would be cancelled or converted to other types of vessels. A capesize took approximately 10 months to build, but contracts were signed to secure a berth place approximately two years before delivery and over one year before steel cutting for the vessel. \"Delivery\" referred to when the vessel was complete and delivered from the shipyard to the owner. Market conditions The demand for dry bulk capesizes was determined by the world economy, especially its basic industries. Over 85% of the cargo carried by capesizes was iron ore and coal. Production and demand for these products increased in a strong economy. Changes in trade patterns also affected the demand for capesizes. For example, if a Western European country decided to switch its supply of iron ore from the United States to Australia, the demand for capesizes would increase since the distance between Europe and Australia is greater than the distance between Western Europe and the United States. Spot charter rates tended to fluctuate more widely than time charter rates, i.e., the highs were higher and the lows were lower in the spot market. Therefore, when the market was high, ship owners sought time charters to lock in the high rates for as long a period as possible while the charterers preferred to trade in the spot market to avoid having to pay high daily rates any longer than necessary. Because Ocean Carriers' vessels were relatively new and a bit larger than the industry average, they earned a premium to the market. For example, new ships generally eamed a 15% premium in daily hire rates relative to the industry- ide average, while ships over 25 years old H L Type here to search d@ & 77F sunny an Ocean Carriers Case Study.pdf X + X C File | C:/Users/Elise%20Perrow/OneDrive/Desktop/Ocean%20Carriers%20Case%20Study.pdf M Draw | | A | at | Ask Copilot + 4 hire rates 1/7 V X O This file has limited permissions. You may not have access to some features. View permissions X EXNIDHI 4 Daily hire rate adjustment factor for ary bulk capesizes based on age or vessel Over 24 years 20 to 24 years 15 to 19 years 10 to 14 years 5 to 9 years Under 5 years 0.65 0.75 0.80 1.00 1.05 1.15 Source: Company estimates This document is authorized for use only by Elise Perrow (eperrow @calstatela.edu). Copying or posting is an infringement of copyright. Please contact customerservice@harvardbusiness.org or 800-988-0886 for additional copies. 202-027 Ocean Carriers The average prevailing spot market rate at the time was $22,000 per day.' With Australian production in iron ore expected to be strong and Indian iron ore exports expected to take off in the next few years, Linn took an optimistic view of the long-term market demand for capesizes. However, she also considered that 63 new vessels were scheduled for delivery in 2001 and that imports of iron ore and coal would probably remain stagnant over the next two years. Linn therefore anticipated that spot rates would fall in 2001 and 2002. In 2003, however, Linn was aware that Australian and Indian ore exports would begin, and that these new supplies would significantly increase trading volumes. Demand for capesizes would likely increase with these higher trading volumes, possibly boosting prices. Exhibit 5 provides data on some demand drivers, fleet size, and average daily hire rates over time. Type here to search USD/EUR +0.29% 11:07 AM 10/26/2024z @ 0 @ Ocean Carriers Case Study.pdf X + - o G '::' File | C:/Users/Elise%20Perrow/OneDrive/Desktop/Ocean%20Carriers%20Case%205tudy.pdf 53 w & & v =9 v Daw ~ @ AD as = 4+ = 4 hire rates 17 v X o i) 8 N @ This file has limited permissions. You may not have access to some features. View permissions X anticipated that spot rates would fall in 2001 and 2002 In 2003, however, Linn was aware that Australian and Indian ore exports would begin, and that these new supplies would significantly increase trading volumes. Demand for capesizes would likely increase with these higher trading volumes, possibly boosting prices. Exhibit 5 provides data on some demand drivers, fleet size, and average daily hire rates over time. Exhibit 5 Worldwide iron ore vessel shipments, fleet size and average daily hire rates for capesize charters, 1994-2001 1994 1995 1996 1997 1998 1999 2000 2001E Iron ore vessel shipments 375 397 385 424 420 410 440 436 Fleet size NA NA NA 540 523 523 552 612 Avg. spot rate $16851 $20149 $11730 14794 $10,105 $9427 $22,575 Avg. 3-yr charter rate $18250 $18,544 $14079 $16083 $13,076 $12,626 $15,344 Source: Company documents Linn enlisted the services of a shipping-industry consulting firm to help her forecast daily hire rates for a new capesize. Worldwide iron ore vessel shipments and charter rates had been very strongly associated historically. The consulting group felt that this relation would continue to hold in the future, and based its forecast of charter rates off of long-term forecasts for worldwide iron ore vessel shipments. The long-term forecast for worldwide iron ore vessel shipments was for 2% annual growth during 2002 to 2005, and then dropping to 1.5% thereafter. Exhibit 6 shows the forecast of daily hire rates that was prepared for Linn. Newbuilding b H Type here to search @
Step by Step Solution
There are 3 Steps involved in it
1 Expert Approved Answer
Step: 1 Unlock
Question Has Been Solved by an Expert!
Get step-by-step solutions from verified subject matter experts
Step: 2 Unlock
Step: 3 Unlock
Students Have Also Explored These Related Finance Questions!