

Question: AN Problem 3 (4x5 = 20 points) Tesla 2010 29 37.56 23 1/10/2015 S 2/28/2010 3 1/11/2017 4/10/2010 5 2015 10 /2010 7/21/2019 12 8/11/2019

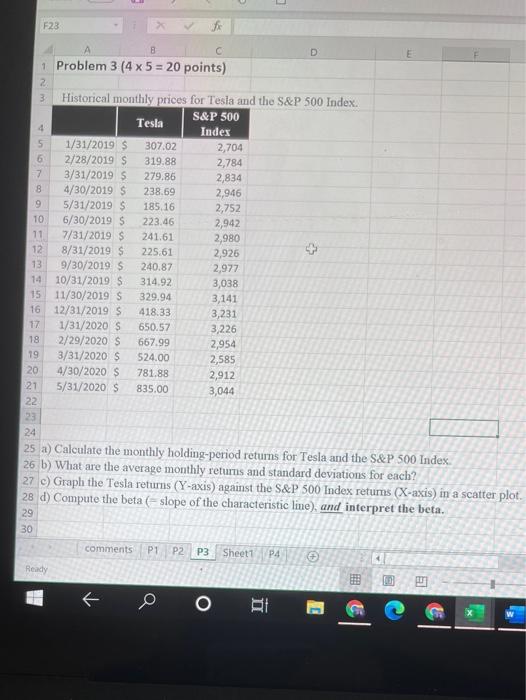
AN Problem 3 (4x5 = 20 points) Tesla 2010 29 37.56 23 1/10/2015 S 2/28/2010 3 1/11/2017 4/10/2010 5 2015 10 /2010 7/21/2019 12 8/11/2019 9/30/2012 10/11/2015 19 11/10/2015 SAP 500 Indes 2.700 2714 24 2. 2.25 2.00 2000 2.00 11 2005 14 1692 30 2.14 TE 1/11/2000 65057 2/29/2020 657 31/20305 $24.00 4/30/2005 7 200 5.00 2.54 2585 20 2041 ce the monthly holding dressed the S&P Sad 24) What they 3 Geg the Tom Yam the series 20 Comptes of the distiller the beta 27 29 30 PPN 1 Q o % 2 W E R A . SD F23 B C D 1 Problem 3 (4 x 5 = 20 points) 2 3 Historical monthly prices for Tesla and the S&P 500 Index. Tesla 4 307.02 319.88 279.86 238.69 185.16 223.46 241.61 225.61 S&P 500 Index 2,704 2,784 2,834 2,946 2,752 2,942 2,980 2,926 2,977 3,038 3,141 3,231 3,226 2,954 2,585 2,912 3,044 5 1/31/2019 $ 6 2/28/2019 $ 7 3/31/2019 S 8 4/30/2019 $ 9 5/31/2019 $ 10 6/30/2019 $ 11 7/31/2019 $ 12 8/31/2019 $ 13 9/30/2019 10/31/2019 S 15 11/30/2019 S 16 12/31/2019 $ 17 1/31/2020 $ 18 2/29/2020 S 19 3/31/2020 $ 20 4/30/2020 S 21 5/31/2020 S 22 240.87 314.92 329.94 418.33 650.57 667.99 524.00 781.88 835.00 23 24 25 a) Calculate the monthly holding-period returns for Tesla and the S&P 500 Index 26 b) What are the average monthly returns and standard deviations for each? 27 c) Graph the Tesla returns (Y-axis) against the S&P 500 Index retums (X-axis) in a scatter plot 28 d) Compute the beta (slope of the characteristic line), and interpret the beta. 29 30 comments P1 P2 P3 Sheet1 P4 Ready E O BE E E
Step by Step Solution
There are 3 Steps involved in it

Get step-by-step solutions from verified subject matter experts