

Question: An unknown disease destroys many bee hives. Using a demand and supply diagram, illustrate and explain what happens to the market for honey. The demand
- An unknown disease destroys many bee hives. Using a demand and supply diagram, illustrate and explain what happens to the market for honey.
- The demand and supply schedule for beef is illustrated in the table below
Price per pound (in USD $)
Quantity Demanded
- Graph the demand and supply of beef. Label all parts of the graph.
- What is the equilibrium price and quantity?
- If the price of beef were $5.00 per pound, would we have a shortage or surplus? How much is the excess?
- If the price of beef were $8.00 per pound, would we have excess demand or excess supply? How much is the excess?
- The American Medical Association puts out a report that beef is unhealthy. Show graphically and explain how this may affect the market for beef.
- The demand and supply schedule for computer engineers is illustrated in the table below
- Graph the demand and supply for computer engineers. Label all parts of the graph
- What is the equilibrium wage and quantity?
- The US President passes legislation that restricts the entry of computer engineers from other countries. Show how this might affect the market for computer engineers.
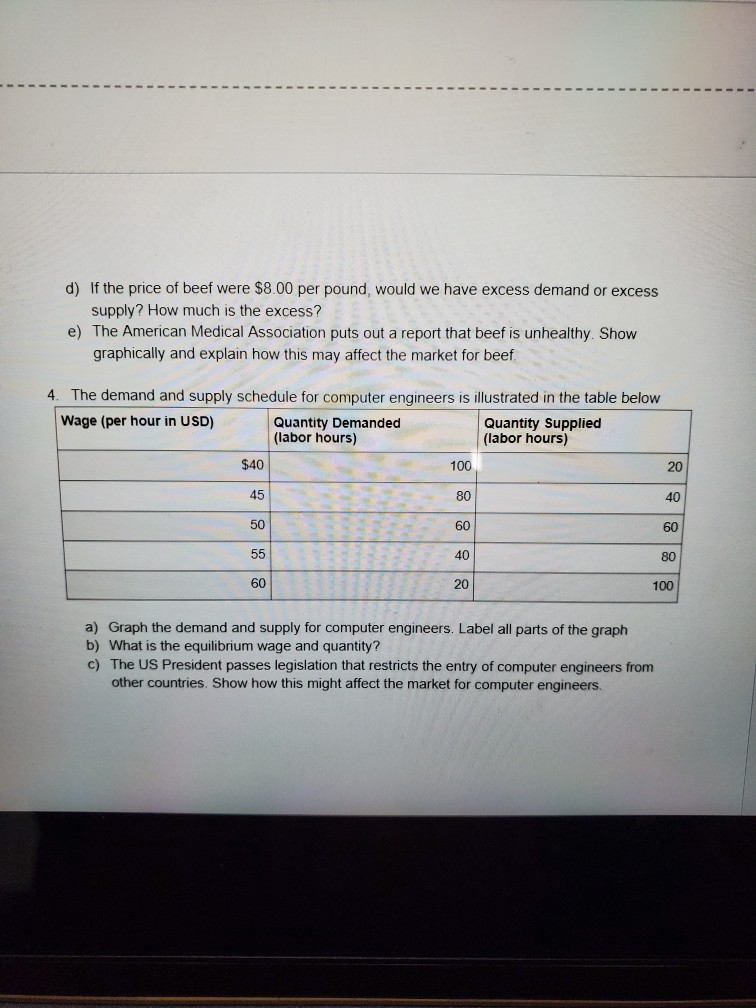
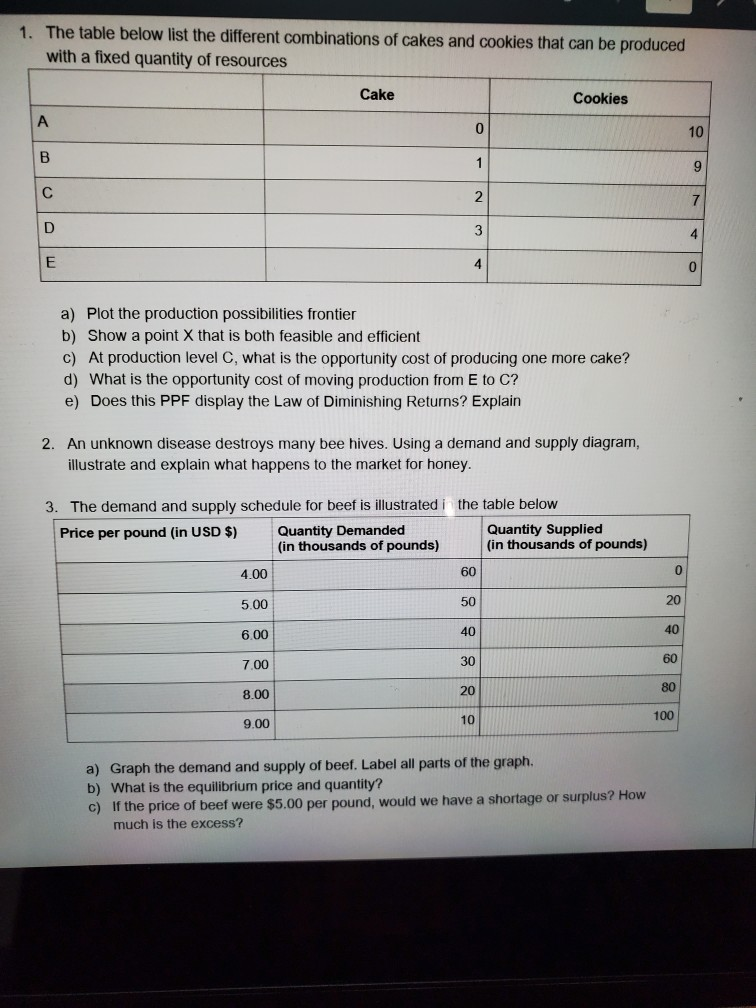
d) If the price of beef were $8.00 per pound, would we have excess demand or excess supply? How much is the excess? e) The American Medical Association puts out a report that beef is unhealthy. Show graphically and explain how this may affect the market for beef. 4. The demand and supply schedule for computer engineers is illustrated in the table below Wage (per hour in USD) Quantity Demanded Quantity Supplied (labor hours) (labor hours) $40 100 20 45 80 40 50 60 60 55 40 80 60 20 100 a) Graph the demand and supply for computer engineers. Label all parts of the graph b) What is the equilibrium wage and quantity? c) The US President passes legislation that restricts the entry of computer engineers from other countries. Show how this might affect the market for computer engineers1. The table below list the different combinations of cakes and cookies that can be produced with a fixed quantity of resources Cake A Cookies 0 B 10 C 2 D 3 E 4 a) Plot the production possibilities frontier b) Show a point X that is both feasible and efficient c) At production level C, what is the opportunity cost of producing one more cake? d) What is the opportunity cost of moving production from E to C? e) Does this PPF display the Law of Diminishing Returns? Explain 2. An unknown disease destroys many bee hives. Using a demand and supply diagram, illustrate and explain what happens to the market for honey. 3. The demand and supply schedule for beef is illustrated inthe table below Price per pound (in USD $) Quantity Demanded (in thousands of pounds) Quantity Supplied (in thousands of pounds) 4.00 60 5.00 50 20 6 00 40 40 7.00 30 8.00 20 80 9.00 10 100 a) Graph the demand and supply of beef. Label all parts of the graph. b) What is the equilibrium price and quantity? c) If the price of beef were $5.00 per pound, would we have a shortage or surplus? How much is the excess
Step by Step Solution
There are 3 Steps involved in it

Get step-by-step solutions from verified subject matter experts