

Analyse the efficiency position of your company in 2021 compared to 2020 and 2019. Use two efficiency
Fantastic news! We've Found the answer you've been seeking!
Question:
Analyse the efficiency position of your company in 2021 compared to 2020 and 2019. Use two efficiency ratios, the inventory turnover and average collection period. Create a X Y Scatter chart with straight lines and markers in Excel for your results with clear indication on axis’ titles. 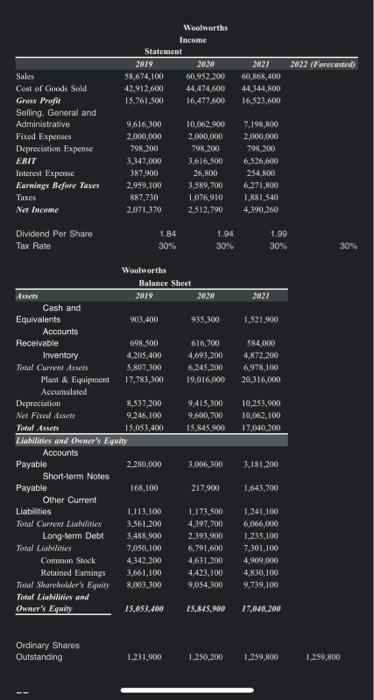
Expert Answer:

Related Book For 
Posted Date:
