

Question: Analyse the risk profile with specific reference to credit risk, loan quality and concentration risk using the following financial statements. Statement of Financial Position As
Analyse the risk profile with specific reference to credit risk, loan quality and concentration risk using the following financial statements.
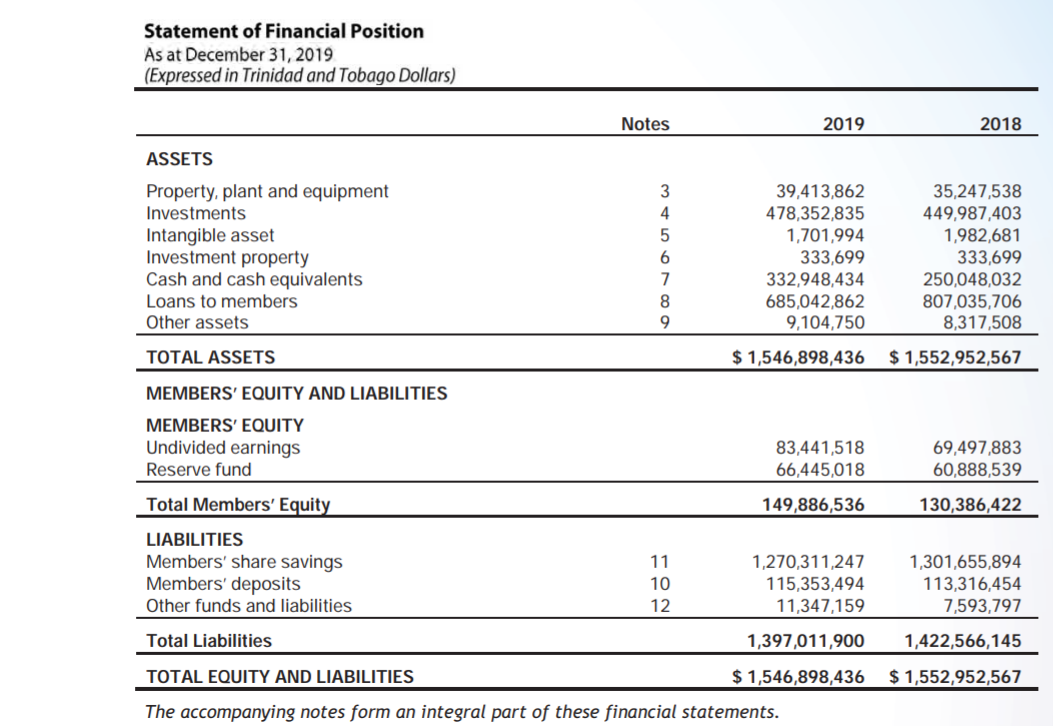
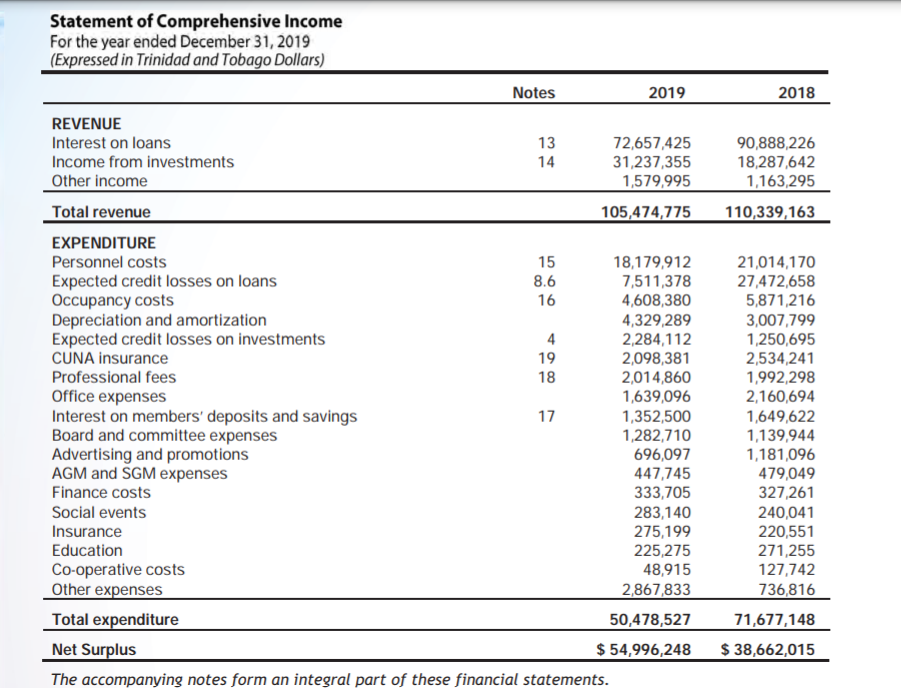
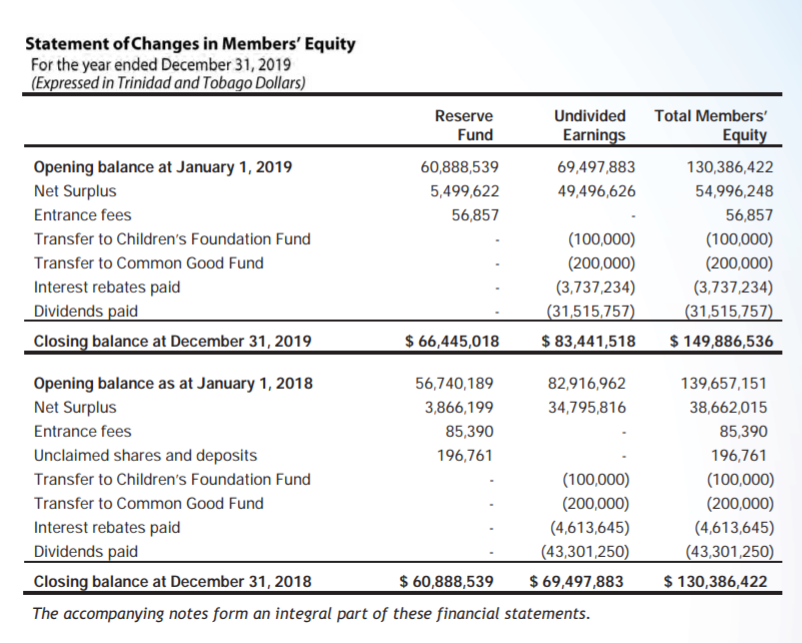
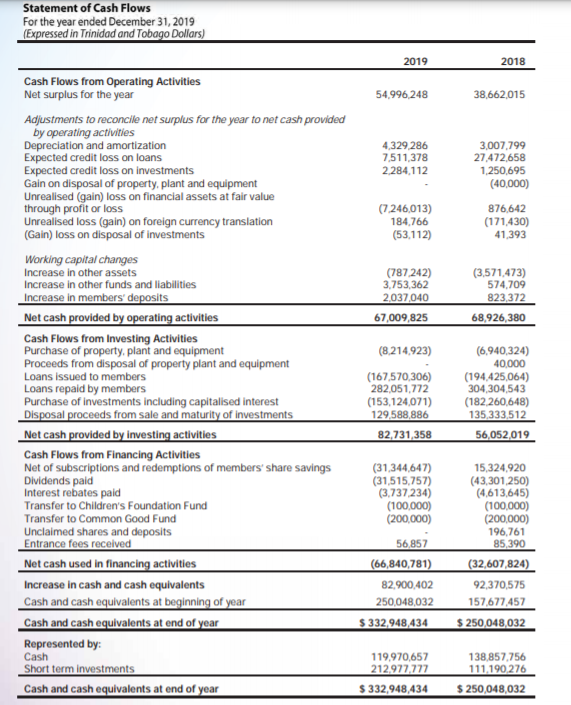
Statement of Financial Position As at December 31, 2019 (Expressed in Trinidad and Tobago Dollars) Notes 2019 2018 ASSETS Property, plant and equipment Investments Intangible asset Investment property Cash and cash equivalents Loans to members Other assets 3 4 5 6 7 8 9 39,413,862 478,352,835 1,701,994 333,699 332,948,434 685,042,862 9,104,750 35,247,538 449,987,403 1,982,681 333,699 250,048,032 807,035,706 8,317,508 TOTAL ASSETS $ 1,546,898,436 $ 1,552,952,567 MEMBERS' EQUITY AND LIABILITIES MEMBERS' EQUITY Undivided earnings Reserve fund 83,441,518 66,445,018 69,497,883 60,888,539 149,886,536 130,386,422 Total Members' Equity LIABILITIES Members' share savings Members' deposits Other funds and liabilities 11 10 12 1,270,311,247 115,353,494 11,347,159 1,301,655,894 113,316,454 7,593,797 Total Liabilities 1,397,011,900 1,422,566,145 TOTAL EQUITY AND LIABILITIES $ 1,546,898,436 $ 1,552,952,567 The accompanying notes form an integral part of these financial statements. 2018 90,888,226 18,287,642 1,163,295 110,339,163 15 Statement of Comprehensive Income For the year ended December 31, 2019 (Expressed in Trinidad and Tobago Dollars) Notes 2019 REVENUE Interest on loans 13 72,657,425 Income from investments 14 31,237,355 Other income 1,579,995 Total revenue 105,474,775 EXPENDITURE Personnel costs 18,179,912 Expected credit losses on loans 8.6 7,511,378 Occupancy costs 16 4,608,380 Depreciation and amortization 4,329,289 Expected credit losses on investments 4 2,284,112 CUNA insurance 2,098,381 Professional fees 18 2,014,860 Office expenses 1,639,096 Interest on members' deposits and savings 17 1,352,500 Board and committee expenses 1,282,710 Advertising and promotions 696,097 AGM and SGM expenses 447,745 Finance costs 333,705 Social events 283,140 Insurance 275,199 Education 225,275 Co-operative costs 48,915 Other expenses 2,867,833 Total expenditure 50,478,527 Net Surplus $ 54,996,248 The accompanying notes form an integral part of these financial statements. 19 21,014,170 27,472,658 5,871,216 3,007,799 1,250,695 2,534,241 1,992,298 2,160,694 1,649,622 1,139,944 1,181,096 479,049 327,261 240,041 220,551 271,255 127,742 736,816 71,677,148 $ 38,662,015 Statement of Changes in Members' Equity For the year ended December 31, 2019 (Expressed in Trinidad and Tobago Dollars) Reserve Fund 60,888,539 5,499,622 56,857 Undivided Earnings 69,497,883 49,496,626 Opening balance at January 1, 2019 Net Surplus Entrance fees Transfer to Children's Foundation Fund Transfer to Common Good Fund Interest rebates paid Dividends paid Closing balance at December 31, 2019 Total Members' Equity 130,386,422 54,996,248 56,857 (100,000) (200,000) (3,737,234) (31,515,757) $ 149,886,536 (100,000) (200,000) (3,737,234) (31,515,757) $ 83,441,518 $ 66,445,018 Opening balance as at January 1, 2018 56,740,189 82,916,962 Net Surplus 3,866,199 34,795,816 Entrance fees 85,390 Unclaimed shares and deposits 196,761 Transfer to Children's Foundation Fund (100,000) Transfer to Common Good Fund (200,000) Interest rebates paid (4,613,645) Dividends paid (43,301,250) Closing balance at December 31, 2018 $ 60,888,539 $ 69,497,883 The accompanying notes form an integral part of these financial statements. 139,657,151 38,662,015 85,390 196,761 (100,000) (200,000) (4,613,645) (43,301,250) $ 130,386,422 Statement of Cash Flows For the year ended December 31, 2019 (Expressed in Trinidad and Tobago Dollars) 2019 2018 54,996,248 38,662.015 4,329,286 7.511,378 2.284,112 3,007,799 27,472,658 1,250,695 (40,000) 876,642 (171,430) 41,393 (7.246,013) 184,766 (53.112) (787.242) 3.753,362 2,037,040 67,009,825 (3.571.473) 574,709 823,372 68,926,380 Cash Flows from Operating Activities Net surplus for the year Adjustments to reconcile net surplus for the year to net cash provided by operating activities Depreciation and amortization Expected credit loss on loans Expected credit loss on investments Gain on disposal of property, plant and equipment Unrealised (gain) loss on financial assets at fair value through profit or loss Unrealised loss (gain) on foreign currency translation (Gain) loss on disposal of investments Working capital changes Increase in other assets Increase in other funds and liabilities Increase in members' deposits Net cash provided by operating activities Cash Flows from Investing Activities Purchase of property, plant and equipment Proceeds from disposal of property plant and equipment Loans issued to members Loans repaid by members Purchase of investments including capitalised interest Disposal proceeds from sale and maturity of investments Net cash provided by investing activities Cash Flows from Financing Activities Net of subscriptions and redemptions of members' share savings Dividends paid Interest rebates paid Transfer to Children's Foundation Fund Transfer to Common Good Fund Unclaimed shares and deposits Entrance fees received Net cash used in financing activities Increase in cash and cash equivalents Cash and cash equivalents at beginning of year Cash and cash equivalents at end of year Represented by: Cash Short term investments Cash and cash equivalents at end of year (8.214,923) (167,570,306) 282,051,772 (153,124,071) 129,588,886 82,731,358 (6.940,324) 40,000 (194.425,064) 304,304,543 (182260,648) 135 333,512 56,052019 (31,344,647) (31,515,757) (3.737.234) (100,000) (200,000) 56,857 (66,840,781) 82.900,402 250,048,032 $ 332,948,434 15,324,920 (43,301,250) (4.613,645) (100,000) (200,000) 196,761 85,390 (32,607,824) 92,370,575 157,677,457 $ 250,048,032 119.970,657 212.977,777 $ 332,948,434 138,857,756 111.190,276 $ 250,048,032 Statement of Financial Position As at December 31, 2019 (Expressed in Trinidad and Tobago Dollars) Notes 2019 2018 ASSETS Property, plant and equipment Investments Intangible asset Investment property Cash and cash equivalents Loans to members Other assets 3 4 5 6 7 8 9 39,413,862 478,352,835 1,701,994 333,699 332,948,434 685,042,862 9,104,750 35,247,538 449,987,403 1,982,681 333,699 250,048,032 807,035,706 8,317,508 TOTAL ASSETS $ 1,546,898,436 $ 1,552,952,567 MEMBERS' EQUITY AND LIABILITIES MEMBERS' EQUITY Undivided earnings Reserve fund 83,441,518 66,445,018 69,497,883 60,888,539 149,886,536 130,386,422 Total Members' Equity LIABILITIES Members' share savings Members' deposits Other funds and liabilities 11 10 12 1,270,311,247 115,353,494 11,347,159 1,301,655,894 113,316,454 7,593,797 Total Liabilities 1,397,011,900 1,422,566,145 TOTAL EQUITY AND LIABILITIES $ 1,546,898,436 $ 1,552,952,567 The accompanying notes form an integral part of these financial statements. 2018 90,888,226 18,287,642 1,163,295 110,339,163 15 Statement of Comprehensive Income For the year ended December 31, 2019 (Expressed in Trinidad and Tobago Dollars) Notes 2019 REVENUE Interest on loans 13 72,657,425 Income from investments 14 31,237,355 Other income 1,579,995 Total revenue 105,474,775 EXPENDITURE Personnel costs 18,179,912 Expected credit losses on loans 8.6 7,511,378 Occupancy costs 16 4,608,380 Depreciation and amortization 4,329,289 Expected credit losses on investments 4 2,284,112 CUNA insurance 2,098,381 Professional fees 18 2,014,860 Office expenses 1,639,096 Interest on members' deposits and savings 17 1,352,500 Board and committee expenses 1,282,710 Advertising and promotions 696,097 AGM and SGM expenses 447,745 Finance costs 333,705 Social events 283,140 Insurance 275,199 Education 225,275 Co-operative costs 48,915 Other expenses 2,867,833 Total expenditure 50,478,527 Net Surplus $ 54,996,248 The accompanying notes form an integral part of these financial statements. 19 21,014,170 27,472,658 5,871,216 3,007,799 1,250,695 2,534,241 1,992,298 2,160,694 1,649,622 1,139,944 1,181,096 479,049 327,261 240,041 220,551 271,255 127,742 736,816 71,677,148 $ 38,662,015 Statement of Changes in Members' Equity For the year ended December 31, 2019 (Expressed in Trinidad and Tobago Dollars) Reserve Fund 60,888,539 5,499,622 56,857 Undivided Earnings 69,497,883 49,496,626 Opening balance at January 1, 2019 Net Surplus Entrance fees Transfer to Children's Foundation Fund Transfer to Common Good Fund Interest rebates paid Dividends paid Closing balance at December 31, 2019 Total Members' Equity 130,386,422 54,996,248 56,857 (100,000) (200,000) (3,737,234) (31,515,757) $ 149,886,536 (100,000) (200,000) (3,737,234) (31,515,757) $ 83,441,518 $ 66,445,018 Opening balance as at January 1, 2018 56,740,189 82,916,962 Net Surplus 3,866,199 34,795,816 Entrance fees 85,390 Unclaimed shares and deposits 196,761 Transfer to Children's Foundation Fund (100,000) Transfer to Common Good Fund (200,000) Interest rebates paid (4,613,645) Dividends paid (43,301,250) Closing balance at December 31, 2018 $ 60,888,539 $ 69,497,883 The accompanying notes form an integral part of these financial statements. 139,657,151 38,662,015 85,390 196,761 (100,000) (200,000) (4,613,645) (43,301,250) $ 130,386,422 Statement of Cash Flows For the year ended December 31, 2019 (Expressed in Trinidad and Tobago Dollars) 2019 2018 54,996,248 38,662.015 4,329,286 7.511,378 2.284,112 3,007,799 27,472,658 1,250,695 (40,000) 876,642 (171,430) 41,393 (7.246,013) 184,766 (53.112) (787.242) 3.753,362 2,037,040 67,009,825 (3.571.473) 574,709 823,372 68,926,380 Cash Flows from Operating Activities Net surplus for the year Adjustments to reconcile net surplus for the year to net cash provided by operating activities Depreciation and amortization Expected credit loss on loans Expected credit loss on investments Gain on disposal of property, plant and equipment Unrealised (gain) loss on financial assets at fair value through profit or loss Unrealised loss (gain) on foreign currency translation (Gain) loss on disposal of investments Working capital changes Increase in other assets Increase in other funds and liabilities Increase in members' deposits Net cash provided by operating activities Cash Flows from Investing Activities Purchase of property, plant and equipment Proceeds from disposal of property plant and equipment Loans issued to members Loans repaid by members Purchase of investments including capitalised interest Disposal proceeds from sale and maturity of investments Net cash provided by investing activities Cash Flows from Financing Activities Net of subscriptions and redemptions of members' share savings Dividends paid Interest rebates paid Transfer to Children's Foundation Fund Transfer to Common Good Fund Unclaimed shares and deposits Entrance fees received Net cash used in financing activities Increase in cash and cash equivalents Cash and cash equivalents at beginning of year Cash and cash equivalents at end of year Represented by: Cash Short term investments Cash and cash equivalents at end of year (8.214,923) (167,570,306) 282,051,772 (153,124,071) 129,588,886 82,731,358 (6.940,324) 40,000 (194.425,064) 304,304,543 (182260,648) 135 333,512 56,052019 (31,344,647) (31,515,757) (3.737.234) (100,000) (200,000) 56,857 (66,840,781) 82.900,402 250,048,032 $ 332,948,434 15,324,920 (43,301,250) (4.613,645) (100,000) (200,000) 196,761 85,390 (32,607,824) 92,370,575 157,677,457 $ 250,048,032 119.970,657 212.977,777 $ 332,948,434 138,857,756 111.190,276 $ 250,048,032
Step by Step Solution
There are 3 Steps involved in it

Get step-by-step solutions from verified subject matter experts