

Question: Analysis and Application: 1. In this experiment, as the force was increased the spring stretched. Draw a series of six sketches to illustrate this effect.

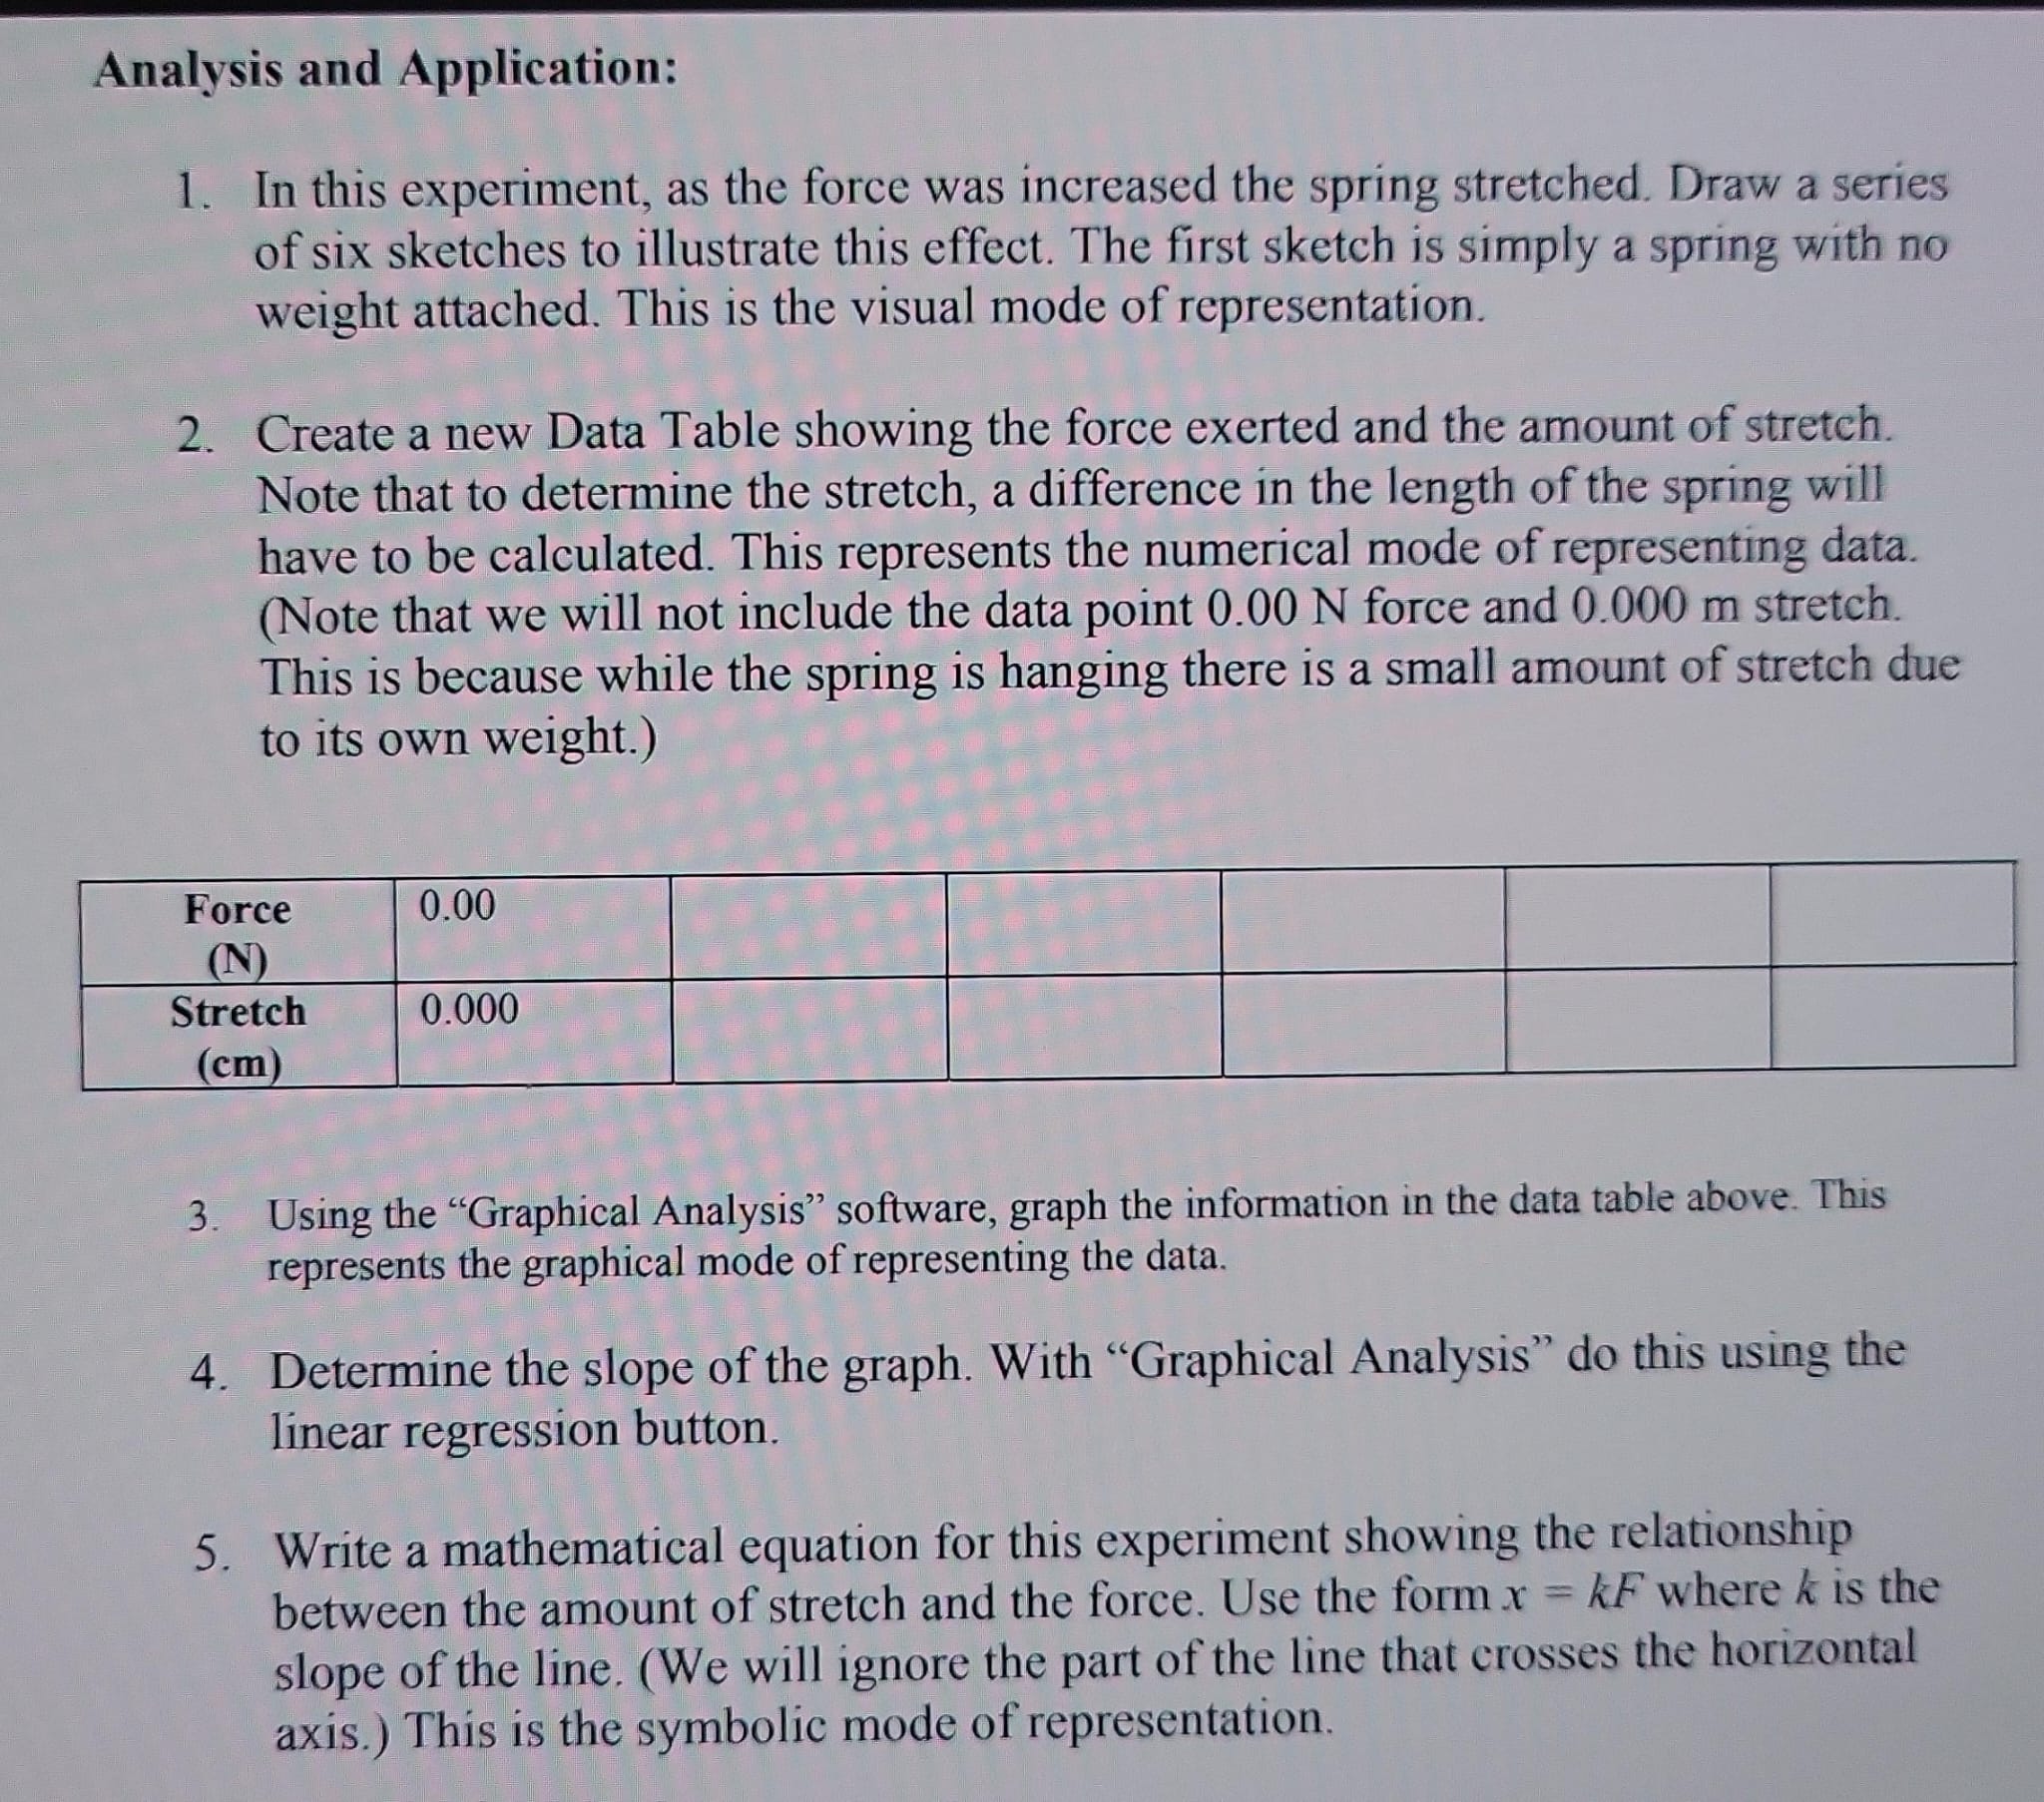
Analysis and Application: 1. In this experiment, as the force was increased the spring stretched. Draw a series of six sketches to illustrate this effect. The first sketch is simply a spring with no weight attached. This is the visual mode of representation. 2. Create a new Data Table showing the force exerted and the amount of stretch. Note that to determine the stretch, a difference in the length of the spring will have to be calculated. This represents the numerical mode of representing data. (Note that we will not include the data point 0.00 N force and 0.000 m stretch. This is because while the spring is hanging there is a small amount of stretch due to its own weight.) Force 0.00 (N) Stretch 0.000 (cm) 3. Using the "Graphical Analysis" software, graph the information in the data table above. This represents the graphical mode of representing the data. 4. Determine the slope of the graph. With "Graphical Analysis" do this using the linear regression button. 5. Write a mathematical equation for this experiment showing the relationship between the amount of stretch and the force. Use the form x = kF where k is the slope of the line. (We will ignore the part of the line that crosses the horizontal axis.) This is the symbolic mode of representation
Step by Step Solution
There are 3 Steps involved in it

Get step-by-step solutions from verified subject matter experts