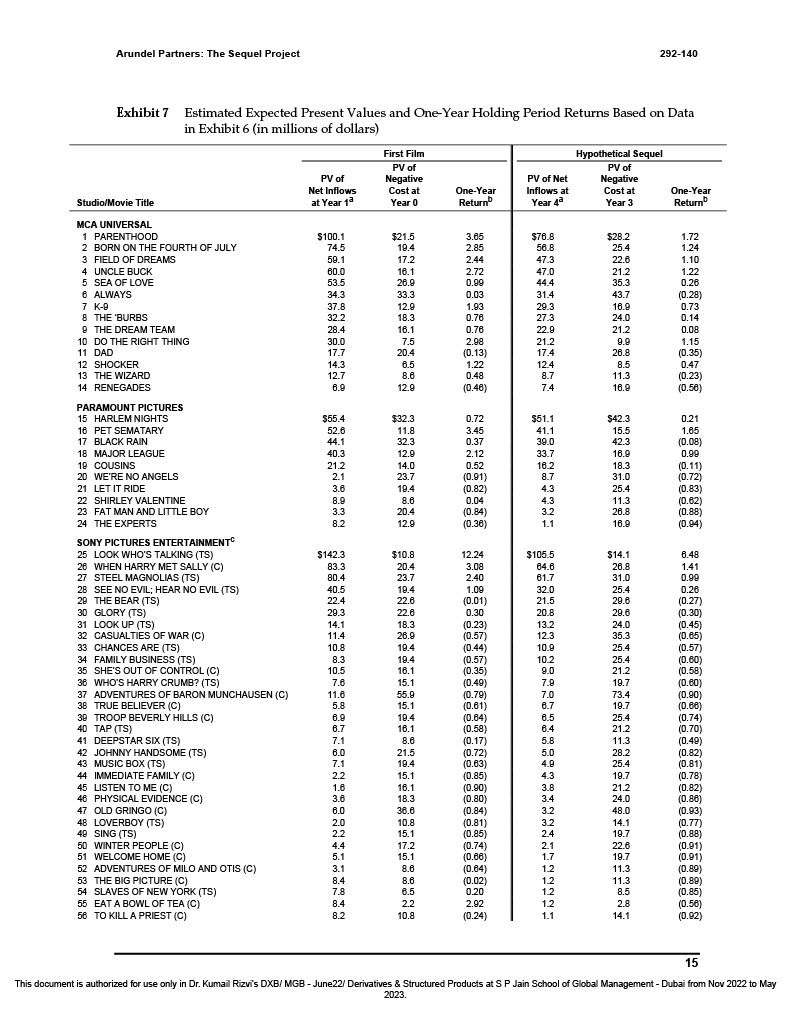
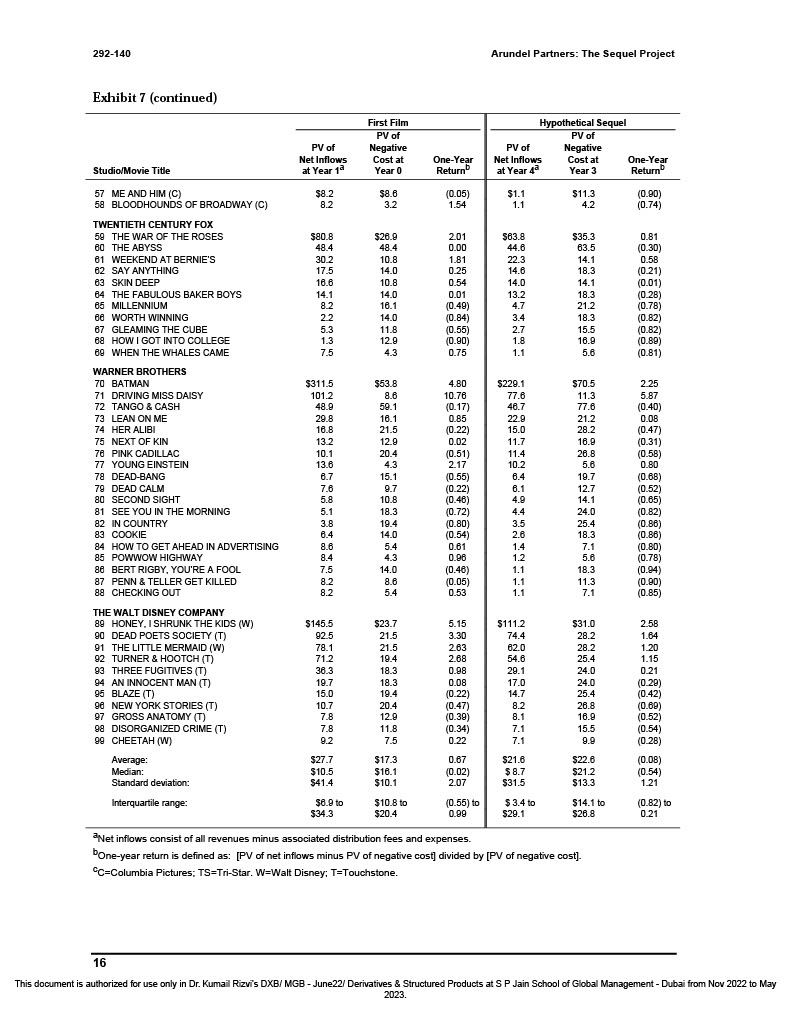
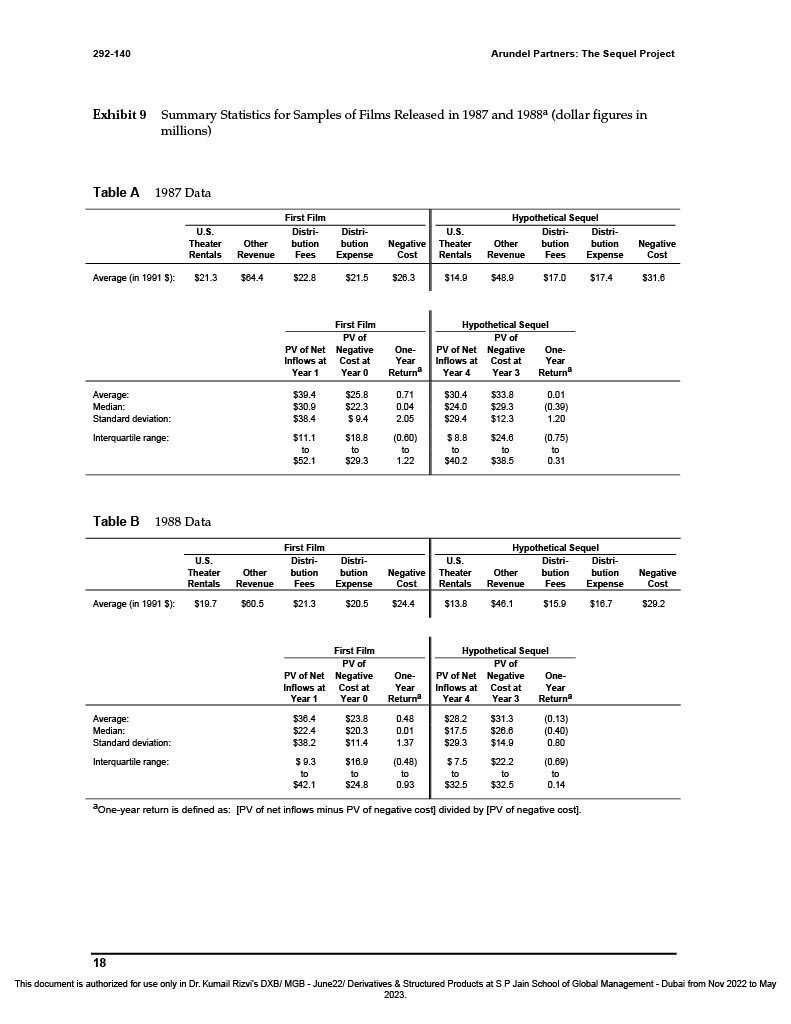
Question: Analysis based on the data of Hypothetical Sequel 1. Identify the sequels (numbers of movies) that may offer positive returns. 2. Identify the sequels (numbers
Analysis based on the data of Hypothetical Sequel
1. Identify the sequels (numbers of movies) that may offer positive returns.
2. Identify the sequels (numbers of movies) that may offer returns more than 10%
3. Identify the sequels (numbers of movies) that may offer returns more than 12%
3. Identify the sequels (numbers of movies) that may offer returns more than 50%
4. Identify the sequels (numbers of movies) that may offer returns more than 100%
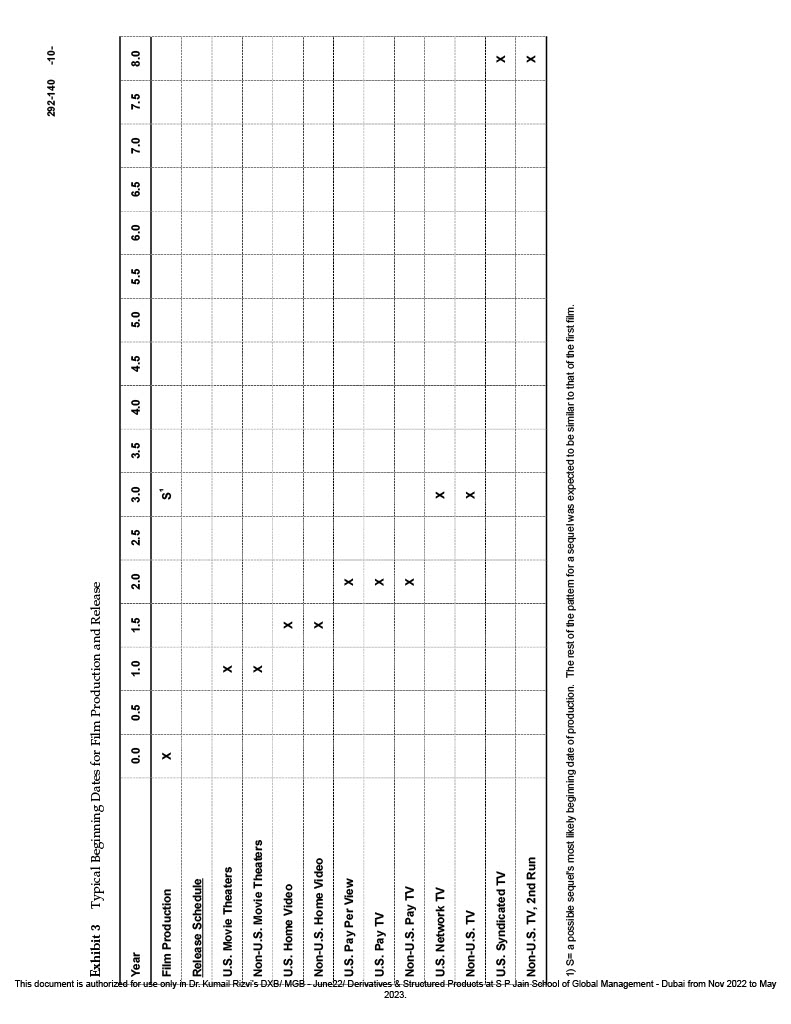
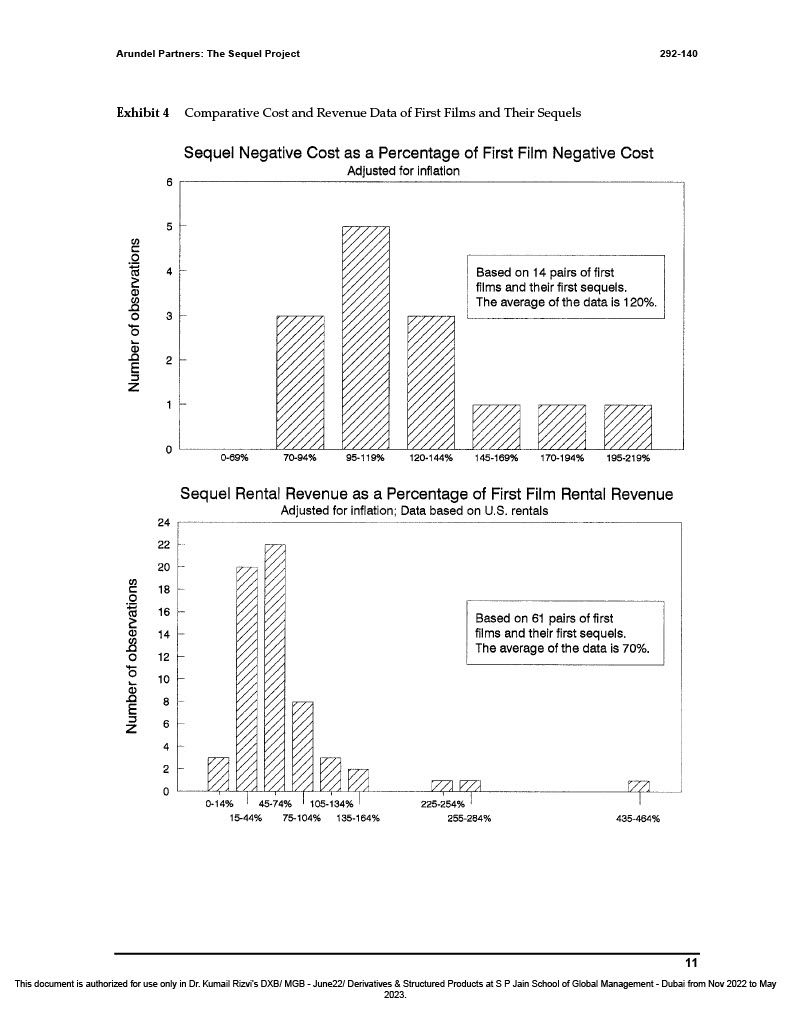
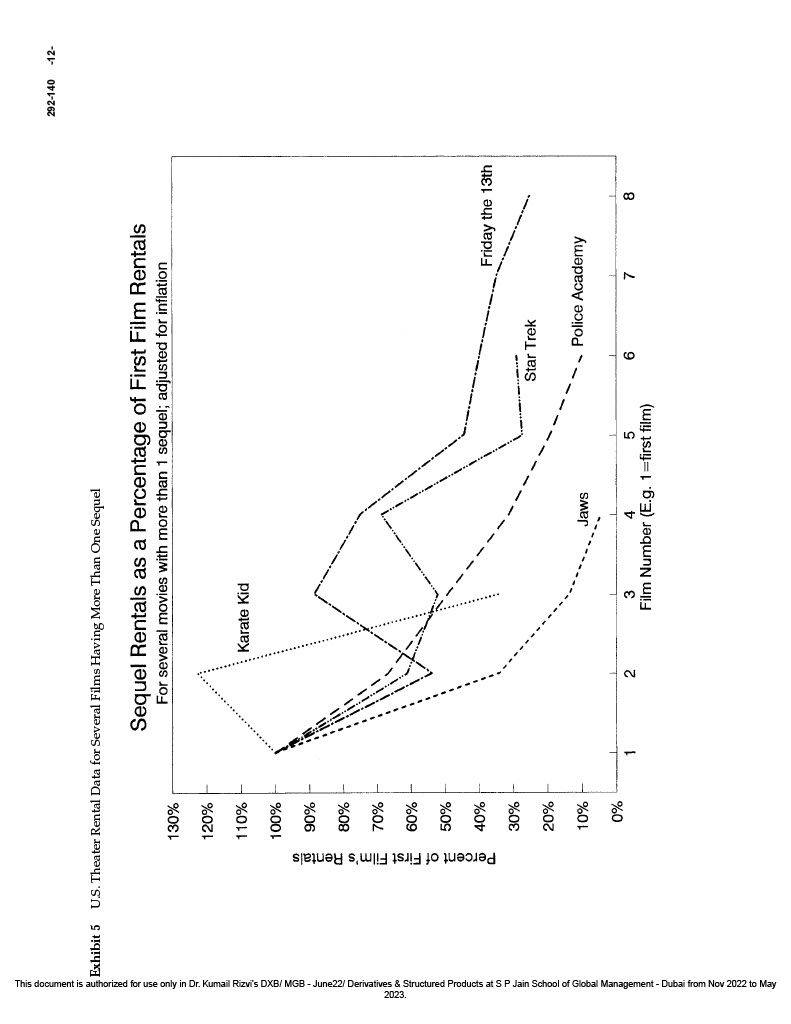
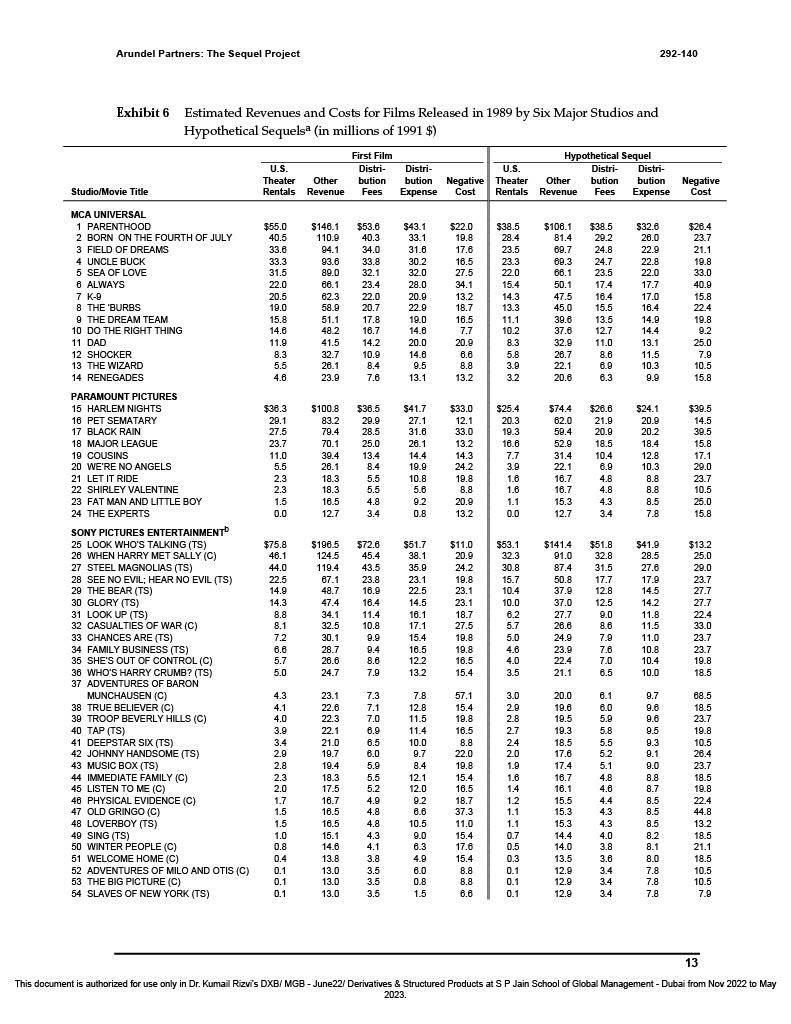
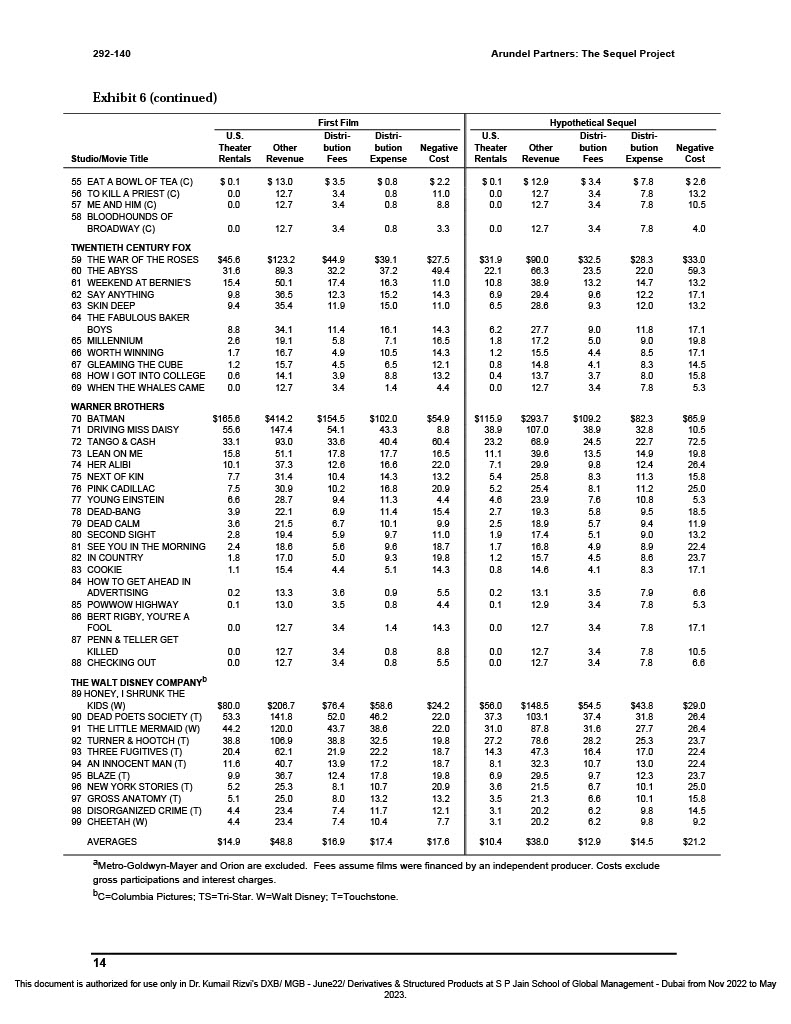
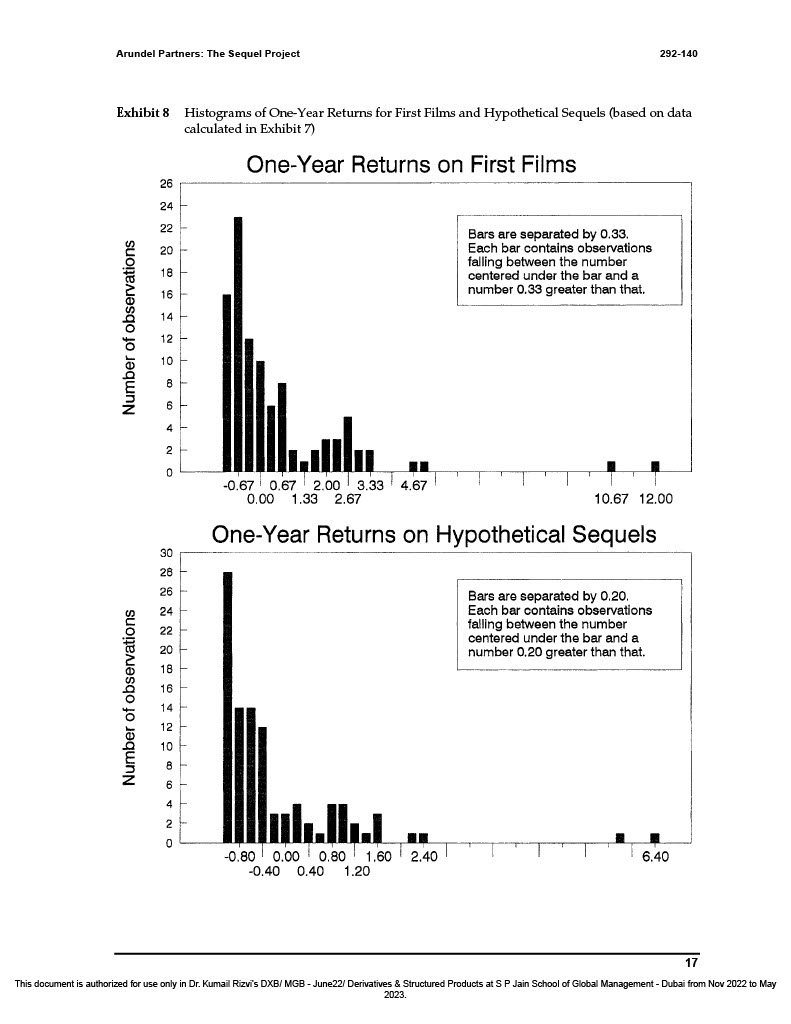
292-140 -10- Exhibit 3 Typical Beginning Dates for Film Production and Release This document is authorized for use only in Dr. Kumail R Year 0.0 1.0 1.5 2.0 2.5 3.0 3.5 4.0 4.5 5.0 5.5 6.0 6.5 7.0 7.5 8.0 Film Production X Release Schedule U.S. Movie Theaters X Non-U.S. Movie Theaters X U.S. Home Video Non-U.S. Home Video U.S. Pay Per View X U.S. Pay TV X 2023 " Non-U.S. Pay TV X U.S. Network TV X Non-U.S. TV X Rizvi's DXB/-MGB -June22/ Derivatives & Structured-Products at-S-P Jain-School of Global Management - Dubai from Nov 2022 to May " U.S. Syndicated TV Non-U.S. TV, 2nd Run " 1) S= a possible sequel's most likely beginning date of production. The rest of the patter for a sequel was expected to be similar to that of the first film.Arundel Partners: The Sequel Project 292-140 Exhibit 4 Comparative Cost and Revenue Data of First Films and Their Sequels Sequel Negative Cost as a Percentage of First Film Negative Cost Adjusted for inflation 6 Based on 14 pairs of first films and their first sequels. The average of the data is 120%. Number of observations 3 2 0 0-69% 70-94% 95-119% 120-144% 145-169% 170-194% 195-219% Sequel Rental Revenue as a Percentage of First Film Rental Revenue Adjusted for inflation; Data based on U.S. rentals 24 Based on 61 pairs of first films and their first sequels. The average of the data is 70%. Number of observations ZAZZA 0-14% | 45-74% 105-134% 225-254% 15-44% 75-104% 135-164% 265-284% 435-464% 11 This document is authorized for use only in Dr. Kumail Rizvi's DXB/ MGB - June22/ Derivatives & Structured Products at S P Jain School of Global Management - Dubai from Nov 2022 to May 2023.292-140 -12- Exhibit 5 U.S. Theater Rental Data for Several Films Having More Than One Sequel Sequel Rentals as a Percentage of First Film Rentals For several movies with more than 1 sequel; adjusted for inflation 130% 120% 110% Karate Kid 100% 90% 80% 70% 2023. Percent of First Film's Rentals This document is authorized for use only in Dr. Kumail Rizvi's DXB/ MGB - June22/ Derivatives & Structured Products at S P Jain School of Global Management - Dubai from Nov 2022 to May 50% Friday the 13th 30% Star Trek 20% - - Police Academy 10% Jaws 8 LO + Film Number (E.g. 1=first film)292-140 Arundel Partners: The Sequel Project Exhibit 6 Estimated Revenues and Costs for Films Released in 1989 by Six Major Studios and Hypothetical Sequelsa (in millions of 1991 $) irst Film Hypothetical Sequel Distri- Distri- U.S Distri Distri- U.S. Other bution bution Negative Theater Other bution bution Negative Theater Cost Cost Rentals Revenue Rentals Revenue Expense Studio/Movie Title Fees Expense Fees MCA UNIVERSAL 1 PARENTHOOD $55.0 $26. $146.1 $53.0 $43.1 $22.0 38.5 $106.1 $38.5 $32.6 19.8 28.4 81.4 20.2 26.0 237 2 BORN ON THE FOURTH OF JULY 40.5 110.8 40.3 33.1 21.1 3 FIELD OF DREAMS 33.8 94.1 34.0 31.6 17.6 23.5 60.7 24.8 22.8 19.8 4 UNCLE BUCK 33.3 93.6 33.8 30.2 16.5 23.3 69.3 24.7 22.8 5 SEA OF LOVE 31.5 89.0 32.1 32.0 27.5 22.0 66.1 23.5 22.0 33.0 40.9 6 ALWAYS 22.0 23.4 28.0 34.1 15.4 50.1 17.4 17.7 15.8 7 K-0 20.5 82.3 22.0 20.9 13.2 14.3 47.5 16.4 17.0 58.0 20.7 22.9 18.7 13.3 45.0 15.5 16.4 22.4 8 THE 'BURBS 19.0 51.1 16.5 11.1 39.6 13.5 14.9 19.8 9 THE DREAM TEAM 15.8 17.8 19.0 14.4 9.2 10 DO THE RIGHT THING 14.8 48.2 16.7 14.6 7.7 10.2 37.6 12.7 11.9 41.5 14.2 20.0 20.9 8.3 32.9 11.0 13.1 25.0 11 DAD 11.5 7.9 12 SHOCKER 8.3 10.9 14.6 6.6 5.8 26.7 8.6 5.5 8.4 8.8 3.9 6.0 10.3 10.5 13 THE WIZARD 26.1 9.5 12.1 14 RENEGADES 4.6 23.0 78 13.1 3.2 32 20.6 15.8 PARAMOUNT PICTURES $100 8 $41.7 $33.0 25.4 $74.4 $28.6 $24.1 $30.5 15 HARLEM NIGHTS $30. 36.5 83.2 29.9 27.1 20.3 32.0 21.9 20.8 14.5 16 PET SEMATARY 20.1 20.2 30.5 17 BLACK RAIN 27.5 79.4 28.5 31.6 33.0 19.3 50.4 20.9 23.7 70.1 25.0 26.1 13.2 16.6 62.9 18.5 18.4 15.8 18 MAJOR LEAGUE 39.4 13.4 14 4 14.3 7.7 31.4 10.4 12.8 17.1 19 COUSINS 11.0 20 WE'RE NO ANGELS 5.5 26.1 8.4 19.9 24.2 3.9 22.1 6.9 10.3 20.0 21 LET IT RIDE 2.3 18.3 5.5 10.8 19.8 1.6 16.7 4.8 8.8 23.7 16.7 4.8 8.8 10.5 22 SHIRLEY VALENTINE 2.3 18.3 5.5 5.6 8.8 1.6 25.0 23 FAT MAN AND LITTLE BOY 1.5 18.5 4.8 9.2 1.1 15.3 4.3 8.5 13.2 12.7 34 7.8 15.8 24 THE EXPERTS D.0 12.7 0.8 SONY PICTURES ENTERTAINMENT 25 LOOK WHO'S TALKING (TS) $75.8 $196.5 $72.6 $51.7 $11.0 $53.1 $141.4 $41.9 $13.2 28.5 124.5 45.4 38.1 20.8 32.3 01.0 25.0 26 WHEN HARRY MET SALLY (C) 46.1 119.4 43.5 87.4 31.5 29.0 27 STEEL MAGNOLIAS (TS) 44.0 35.9 24 .2 30.8 27.6 28 SEE NO EVIL; HEAR NO EVIL (TS) 22.5 87.1 23.8 23.1 9.8 15.7 50.8 17.7 17.9 23.7 14.9 16.9 22 5 23.1 10.4 37. 2.8 14.5 27.7 29 THE BEAR (TS) 37.0 12.5 30 GLORY (TS) 16.4 14.5 27.7 14.3 23.1 10.0 8.8 11.4 18.1 18.7 6.2 27.7 9.0 22.4 31 LOOK UP (TS) 17.1 27.5 5.7 26.6 8.6 11.5 32 CASUALTIES OF WAR (C) 8.1 32.5 10.8 33.0 7.2 30.1 154 19.8 5.0 24.9 7.9 11.0 23.7 33 CHANCES ARE (TS 6.8 28.7 94 8.5 19.8 4.6 3.9 7.6 10.8 23.7 34 FAMILY BUSINESS (TS) 35 SHE'S OUT OF CONTROL (C) 5.7 26.6 8.6 12 2 6.5 4.0 7.0 10.4 19.8 15.4 15 6.5 10.0 18.5 36 WHO'S HARRY CRUMB? (TS) 5.0 13.2 37 ADVENTURES OF BARON 4.3 23.1 7.3 78 57.1 3.0 20.0 8.1 9.7 88.5 MUNCHAUSEN (C) 4.1 22.6 7.1 2.8 15.4 19.8 8.0 9.8 18.5 38 TRUE BELIEVER (C) 38 TROOP BEVERLY HILLS (C) 4.0 22.3 7.0 1.5 2.8 9.5 5.9 9.6 23.7 19.8 40 TAP (TS) 6.9 11.4 9.5 3.4 6.5 10.0 24 9.3 10.5 41 DEEPSTAR SIX (TS] 42 JOHNNY HANDSOME (TS) 2.9 19.7 9.7 20 9.1 28.4 2.8 19.4 5.9 8.4 9.8 1.0 7.4 5.1 9.0 23.7 43 MUSIC BOX (TS) 44 IMMEDIATE FAMILY (C) 2.3 18.3 5.5 2.1 15.4 1.6 16.7 4.8 8.8 18.5 45 LISTEN TO ME (C) 2.0 17.5 5.2 2.0 16.5 1.4 16.1 4.6 8.7 19.8 8.5 46 PHYSICAL EVIDENCE (C) 1.7 16.7 4.9 9.2 12 22.4 47 OLD GRINGO (C) 1.5 16.5 4.8 6.6 8.5 44.8 1.5 0.5 1.1 3.2 48 LOVERBOY (TS) 18.5 4.8 11.0 0.7 8.2 8.5 49 SING (TS) 1.0 15.1 4.3 9.0 0.8 14.6 4.1 8.3 17.6 0.5 8.1 21.1 50 WINTER PEOPLE (C) 8.0 8.5 51 WELCOME HOME (C) 0.4 13.8 3.8 4.8 15.4 0.3 10.5 52 ADVENTURES OF MILO AND OTIS (C) 0.1 13.0 3.5 8.0 0.1 13.0 0.8 0.5 53 THE BIG PICTURE (C) D.1 3.5 0.1 0.1 13.0 15 0.1 12.9 7.8 7.9 54 SLAVES OF NEW YORK (TS) 13 This document is authorized for use only in Dr. Kumail Rizvi's DXB/ MGB - June22/ Derivatives & Structured Products at S P Jain School of Global Management - Dubai from Nov 2022 to May 2023.292-140 Arundel Partners: The Sequel Project Exhibit 6 (continued) First Film Hypothetical Sequel U.S. Distri Distri- U.S. Distri- Distri Theater Other bution bution Negative Theater Other bution bution Negative Revenue Fees Expense Cost Rentals Revenue Fees Expense Cost Studio/Movie Title Rentals $ 0.1 $3.4 $ 2.6 55 EAT A BOWL OF TEA (C) $ 13.0 $ 0.8 $2.2 $ 12.9 $7.8 $ 0.1 132 56 TO KILL A PRIEST (C) 00 12.7 3.4 11.0 12.7 3.4 7 8 7.B 57 ME AND HIM (C) 0.0 12.7 127 10.5 58 BLOODHOUNDS OF 0.0 12.7 3.4 7.8 4.0 12.7 3.4 3.3 BROADWAY (C) TWENTIETH CENTURY FOX 532. $28.3 59 THE WAR OF THE ROSES 123.2 $44.9 $39. $27.5 531.9 22.1 23.5 22 0 50 3 49.4 60 THE ABYSS 31.6 80.3 32.2 37.2 10.8 13.2 147 13.2 61 WEEKEND AT BERNIE'S 15.4 50.1 17.4 18.3 11.0 38.9 6.9 20.4 9.6 12 2 17.1 62 SAY ANYTHING 98 38.5 12.3 15.2 14.3 11.8 150 110 120 13 2 63 SKIN DEEP 35 4 64 THE FABULOUS BAKER 34.1 1.4 10-1 14.3 3.2 21.1 4.0 11.8 17.1 BOYS 65 MILLENNIUM 26 19.1 5.8 7.1 16.5 1.8 17.2 5.0 9.0 19.8 17.1 86 WORTH WINNING 1.7 18 7 4.9 10.5 14.3 1.2 15.5 4.4 8.5 8.3 14.5 67 GLEAMING THE CUBE 1.2 15.7 4.5 8.5 12.1 0.8 14.8 4.1 14.1 3.9 8.8 13.2 0.4 13.7 3.7 15.8 0.6 8.0 68 HOW I GOT INTO COLLEGE 34 7.B 53 THE WHALES CAME 0.0 12.7 34 14 4.4 12.7 WARNER BROTHERS $115.8 70 BATMAN $414.2 $154.5 $102 0 $293.7 $100.2 $82.3 $165.0 $54.9 55.6 1471 54.1 43.3 8.8 38.9 107.0 38.9 32.B 10.5 71 DRIVING MISS DAISY 72 TANGO & CASH 3.6 40.4 80.4 3.8.9 24.5 22.7 72.5 33.1 83.0 23.2 14.0 15.8 19.8 73 LEAN ON ME 51.1 7.8 17.7 18.5 11.1 39.6 13.5 74 HER ALIBI 10.1 37.3 2.6 16 6 22.0 71 20.9 9.8 12 4 28.4 75 NEXT OF KIN 7.7 31.4 10.4 14.3 13.2 5.4 25.8 B.3 11.3 15.8 25.0 76 PINK CADILLAC 7.5 30.9 10.2 16.8 20.9 5.2 25.4 8.1 11.2 28.7 9.4 11.3 4.4 4.6 23.9 6.6 7.6 10.8 77 YOUNG EINSTEIN 9.5 18.5 78 DEAD-BANG 3.9 22.1 6.9 11.4 15.4 2.7 19.3 5.8 79 DEAD CALM 3.6 21.5 6.7 10.1 2.5 18.9 5.7 9.4 11.9 5.1 9.0 13.2 80 SECOND SIGHT 78 19.4 5.9 9.7 11.0 1.9 17.4 81 SEE YOU IN THE MORNING 24 18.6 5.6 9.6 18.7 1.7 16.8 4.9 8.9 22.4 17.0 5.0 9.3 19.8 1.2 15.7 4.5 8.6 23.7 82 IN COUNTRY 1.8 83 COOKIE 1.1 15.4 4.4 5.1 14.3 14.6 41 8.3 17.1 84 HOW TO GET AHEAD IN 13.3 0.9 1.2 13.1 3.5 8.6 ADVERTISING 0.2 3.8 5.5 85 POWWOW HIGHWAY 0.1 13.0 3.5 4.4 11 12.9 34 5.3 86 BERT RIGBY. YOU'RE A 14.3 12.7 3.4 7.8 17.1 0.0 12.7 3.4 1 4 FOOL 87 PENN & TELLER GET 10.5 12.7 0.0 KILLED 0.0 12.7 10 12 7 14 7.8 88 CHECKING OUT 00 127 34 0.8 THE WALT DISNEY COMPANY 89 HONEY, I SHRUNK THE $80.0 $206. $70.4 $58.6 $24.2 $56.0 $148.5 $54.5 $43.8 $29.0 KIDS (W) 48.2 22.0 37.3 103.1 37.4 31.8 28.4 90 DEAD POETS SOCIETY (T) 53.3 141. 62.0 91 THE LITTLE MERMAID (W) 44 2 120.0 43.7 38.6 220 31.0 87.8 31.6 27.7 28.4 92 TURNER & HOOTCH (T) 38.8 108.9 38.8 32 5 19.8 27.2 78.6 28.2 25.3 23.7 83 THREE FUGITIVES (T) 20.4 82.1 21.8 22 2 18.7 14.3 47.3 16.4 17_0 22.4 13.9 17.2 18.7 8.1 32.3 10.7 13.0 22.4 94 AN INNOCENT MAN (T) 11.6 40.7 9.8 38.7 12.4 17.8 19.8 6.9 29.5 9.7 12.3 23.7 95 BLAZE (T) 6.7 10.1 25.0 96 NEW YORK STORIES (T) 5.2 25.3 8.1 10.7 20.9 3.6 21.5 10.1 15.8 97 GROSS ANATOMY (T) 5.1 25.0 8.0 13.2 13.2 3.5 21.3 6.8 20.2 6.2 9.8 14.5 98 DISORGANIZED CRIME (T) 4 4 23 4 7.4 11.7 121 3.1 99 CHEETAH (W) 4 4 73 4 74 10 4 77 31 $14.5 $21.2 AVERAGES $14.8 48. 16. $17.4 $17.6 $10.4 $38.0 $12.9 "Metro-Goldwyn-Mayer and Orion are excluded. Fees assume films were financed by an independent producer. Costs exclude gross participations and interest charges DC=Columbia Pictures; TS=Tri-Star. W=Walt Disney: T=Touchstone. 14 This document is authorized for use only in Dr. Kumail Rizvi's DXB/ MGB - June22/ Derivatives & Structured Products at S P Jain School of Global Management - Dubai from Nov 2022 to May 2023.Arundel Partners: The Sequel Project 292-140 Exhibit 7 Estimated Expected Present Values and One-Year Holding Period Returns Based on Data in Exhibit 6 (in millions of dollars) First Film Hypothetical Sequel PV of PV of PV of Negative PV of Net Negative Net Inflows Cost at One-Year Inflows at Cost at One-Year Studio/Movie Title at Year 13 Year 0 Return Year 43 Year 3 Return MCA UNIVERSAL 1 PARENTHOOD $100.1 $21.5 3.05 $76.8 $28.2 1.72 BORN ON THE FOURTH OF JULY 74.5 19.4 2.85 58.8 25.4 1.24 FIELD OF DREAMS 59.1 17.2 2.44 47.3 22.6 1.10 4 UNCLE BUCK 60.0 16.1 2.72 47.0 21.2 1.22 5 SEA OF LOVE 53.5 26.9 0.99 44.4 35 3 D.28 B ALWAYS 34.3 33.3 0.03 31.4 437 0.28 7 K-9 37.8 12.9 1.93 29.3 16.9 0.73 8 THE 'BURBS 32.2 18.3 D.78 27.3 24.0 0.14 THE DREAM TEAM 28.4 16.1 0.78 22.9 21.2 0.08 10 DO THE RIGHT THING 30.0 7.5 2.98 21.2 9.9 1.15 11 DAD 17.7 20.4 (D.13) 17 4 26.8 D.35) 12 SHOCKER 14.3 6.5 1.22 124 8.5 D.47 13 THE WIZARD 12.7 8.6 0.48 8.7 1.3 0.23 14 RENEGADES 12.9 (D.48) 7.4 160 (D.56 PARAMOUNT PICTURES 15 HARLEM NIGHTS $55.4 $32.3 0.72 $51.1 $42.3 0.21 16 PET SEMATARY 52.6 11.8 3.45 41.1 15 5 1.85 17 BLACK RAIN 44.1 32.3 0.37 39.0 42.3 0.0.8 18 MAJOR LEAGUE 40.3 12.9 2.12 33.7 16.9 0.99 18 COUSINS 21.2 14.0 0.52 18.2 18.3 (0.11) 20 WE'RE NO ANGELS 2.1 23.7 (0.91) 8.7 31.0 (D.72) 21 LET IT RIDE 3.6 19.4 (D.82) 4.3 25.4 (D.83) 22 SHIRLEY VALENTINE 8.9 8.6 D.04 4.3 11.3 0.82 23 FAT MAN AND LITTLE BOY 3.3 20.4 (D.84) 3.2 26 8 (0.88) 24 THE EXPERTS 8.2 12.9 (D.36) 1.1 18 9 SONY PICTURES ENTERTAINMENT 25 LOOK WHO'S TALKING (TS) $142.3 $10.8 12.24 $105.5 $14.1 6.48 26 WHEN HARRY MET SALLY (C) 83.3 20.4 3.08 84.6 26.8 1.41 27 STEEL MAGNOLIAS (TS) 80.4 23.7 240 81.7 31.0 0.99 SEE NO EVIL; HEAR NO EVIL (TS) 40.5 19.4 1.09 32.0 25.4 0.26 20 THE BEAR (TS 22.4 22.6 (D.01) 21.5 29.8 (0.27) 30 GLORY (TS) 29.3 22.8 0.30 20.B 29.6 (D.30) 31 LOOK UP (TS) 14.1 18.3 (D.23) 13.2 24.0 (0.45 32 CASUALTIES OF WAR (C) 11.4 26.9 (D.57) 12.3 35.3 (D.85 33 CHANCES ARE (TS) 10.8 19.4 (D.44) 10.0 25.4 (0.57 34 FAMILY BUSINESS (TS) 8.3 19.4 (D.57) 10.2 25.4 (0.80) 35 SHE'S OUT OF CONTROL (C) 10.5 16.1 (D.35) 9.0 21.2 (D.58) 36 WHO'S HARRY CRUMB? (TS) 7.6 15.1 (D.49) 197 (D.80) 37 ADVENTURES OF BARON MUNCHAUSEN (C) 11.6 55.9 (0.79) 7.0 73.4 (0.90) 38 TRUE BELIEVER (C) 5.8 15.1 (D.81) 8.7 19.7 (0.68) 30 TROOP BEVERLY HILLS (C) 6.9 19.4 (D.64) 25.4 (0.74) 40 TAP (TS) 6.7 16.1 (0.58) 6.4 21.2 (D.70) 41 DEEPSTAR SIX (TS) 7.1 8.6 (0.17) 5.8 11.3 (0.49) 42 JOHNNY HANDSOME (TS) 6.0 21.5 (D.72) 5.0 28.2 (D.82) 43 MUSIC BOX (TS) 7.1 19.4 (0.63) 4.0 25.4 0.81 44 IMMEDIATE FAMILY (C) 2.2 15.1 (D.85 4.3 197 (D.78) 15 LISTEN TO ME (C) 1.8 16.1 (D.90) 3.8 21.2 (0.82) 18 PHYSICAL EVIDENCE (C) 3.6 18.3 (D.80) 3.4 24.0 (D.88) 47 OLD GRINGO (C) 6.0 18.6 (D.84) 3.2 48.0 (D.23) 18 LOVERBOY (TS) 2.0 10.8 (D.81) 3.2 14.1 (0.77) 40 SING (TS) 2.2 15.1 (D.85) 24 19.7 (D.8.8) 60 WINTER PEOPLE (C) 4.4 17.2 (D.74) 21 22.6 (0.91) 61 WELCOME HOME (C) 5.1 15.1 (D.68) 1.7 19.7 (D.91) 52 ADVENTURES OF MILO AND OTIS (C) 3.1 8.6 (D.64) 1.2 11.3 (D.89) 53 THE BIG PICTURE (C) 8.4 8.6 (D.02) 1.2 11.3 (D.89 54 SLAVES OF NEW YORK (TS) 7.8 6.5 D.20 8.5 (D.85) 55 EAT A BOWL OF TEA (C) 8.4 2.2 2 92 12 2.8 (D.58 56 TO KILL A PRIEST (C) 8.2 10.8 (D.24) 14.1 (D.82) 15 This document is authorized for use only in Dr. Kumail Rizvi's DXB/ MGB - June22/ Derivatives & Structured Products at S P Jain School of Global Management - Dubai from Nov 2022 to May 2023.292-140 Arundel Partners: The Sequel Project Exhibit 7 (continued) First Film Hypothetical Sequel PV of PV of PV of Negative PV of Negative Net Inflows Cost at One-Year Net Inflows Cost at One-Year Studio/Movie Title at Year 1a Year 0 Return at Year 4 Year 3 Return" 17 ME AND HIM (C) $8.2 $8.0 (0.05) $1.1 $11.3 (0.80) 58 BLOODHOUNDS OF BROADWAY (C) 8 7 154 1.1 4.2 (0.74) TWENTIETH CENTURY FOX 50 THE WAR OF THE ROSES $80 8 $26.9 2 01 $63.8 $35.3 0181 THE ABYSS 48.4 48 4 0.00 44.6 63 5 31 WEEKEND AT BERNIE'S 30.2 10 8 1.81 22.3 14.1 0.58 82 SAY ANYTHING 17.5 14.0 0.25 14.6 18.3 (0.21) 83 SKIN DEEP 18.6 10 8 0.54 14.0 14.1 (0.01) 64 THE FABULOUS BAKER BOYS 14.1 14.0 0.01 13.2 18.3 (0.28) 5 MILLENNIUM 8.2 18.1 (0.49) 4.7 21.2 (0.78) WORTH WINNING 22 14.0 (0.84 3.4 18.3 (0.82 87 GLEAMING THE CUBE 11.8 (0.55) 2.7 15.5 (0.82) 88 HOW I GOT INTO COLLEGE 1.3 (0.90) 1.8 18 9 (0.89) 19 WHEN THE WHALES CAME 75 0.75 1.1 5.8 (0.81) WARNER BROTHERS 70 BATMAN $311.5 $53.8 4.80 $229.1 $70.5 2 25 DRIVING MISS DAISY 101.2 8.6 0.76 77.6 11.3 5.87 TANGO & CASH 48.0 59.1 (0.17) 48.7 77.6 (0.40) 73 LEAN ON ME 29 8 18.1 0.85 22 9 21.2 0.08 74 HER ALIBI 18.8 21.5 (0.22) 15.0 28.2 (0.47) 5 NEXT OF KIN 13.2 12.9 0.02 11.7 16.0 (0.31) PINK CADILLAC 10.1 20.4 (0.51) 11.4 26.8 (0.58) 7 YOUNG EINSTEIN 13.6 4.3 2.17 10 2 0.80 78 DEAD-BANG 8.7 15.1 (0.55) 6.4 19.7 (0.6B 79 DEAD CALM 7 6 9.7 (0.22) 6.1 12.7 (0.52) OND SIGHT 5.8 10.8 (0.46) 14.1 (0.65) 81 SEE YOU IN THE MORNING 5.1 18.3 (0.72 4.4 24.0 (0.82 82 IN COUNTRY 3.8 19.4 (0.80) 3.5 25.4 (0.86) 83 COOKIE 6.4 14.0 (0.54) 2.6 18.3 (0.86) 84 HOW TO GET AHEAD IN ADVERTISING 8.6 5.4 0.61 1.4 7.1 (0.BD) 35 POWWOW HIGHWAY 8.4 4.3 0.96 1.2 5.8 (0.78) BERT RIGBY, YOU'RE A FOOL 7.5 14.0 0.48 1.1 18.3 (0.84) PENN & TELLER GET KILLED 8.2 8.6 10.05 11.3 (0.90) 18 CHECKING OUT 54 0.53' 7.1 (0.85) THE WALT DISNEY COMPANY 89 HONEY, I SHRUNK THE KIDS (W) $145.5 523.7 5.15 $111.2 $31.0 2.58 0 DEAD POETS SOCIETY (T) 92 5 21.5 3.30 74.4 28.2 1.64 91 THE LITTLE MERMAID (W) 78.1 21.5 2.63 82.0 28.2 1.20 82 TURNER & HOOTCH (T) 71.2 19.4 2.68 54.6 25.4 1.15 93 THREE FUGITIVES (T) 38.3 18.3 0.08 29.1 24.0 0.21 94 AN INNOCENT MAN (T) 197 18.3 0.08 17.0 24.0 (0.29) 95 BLAZE (T) 15.0 19.4 10.22 14.7 25.4 (0.42) 96 NEW YORK STORIES (T) 10.7 20.4 (0.47 8.2 26.8 (0.68) GROSS ANATOMY (T) 78 12 9 (0.39) 8.1 16.9 (0.52) 98 DISORGANIZED CRIME (T) 7 8 11.8 (0.34) 7.1 15 5 (0.54) 39 CHEETAH (W) 0.22 7.1 (0.28 Average: $27.7 $17.3 0.67 $21.6 $22.6 (0.DB) Median: $10.5 $16.1 (0.02) $8.7 $21.2 0.54) Standard deviation: $41 4 $10 1 2 07 $31.5 $13.3 1.21 Interquartile range: $6.9 to $10 8 to (0.55) 1 $ 3.4 to $14.1 to (0.82) to 34.3 $20.4 0.09 $29.1 $26.8 0.21 Net inflows consist of all revenues minus associated distribution fees and expenses One-year return is defined as: [PV of net inflows minus PV of negative cost] divided by [PV of negative cost]. C=Columbia Pictures; TS=Tri-Star. W=Walt Disney; T=Touchstone. 16 This document is authorized for use only in Dr. Kumail Rizvi's DXB/ MGB - June22/ Derivatives & Structured Products at S P Jain School of Global Management - Dubai from Nov 2022 to May 2023.Arundel Partners: The Sequel Project 292-140 Exhibit 8 Histograms of One-Year Returns for First Films and Hypothetical Sequels (based on data calculated in Exhibit 7) One-Year Returns on First Films 26 Bars are separated by 0.33. Each bar contains observations falling between the number centered under the bar and a number 0.33 greater than that. Number of observations T -0.67 0.67 2.00 3.33 4.67 0.00 1.33 2.67 10.67 12.00 One-Year Returns on Hypothetical Sequels Bars are separated by 0.20. Each bar contains observations falling between the number centered under the bar and a number 0.20 greater than that. Number of observations 0.80 0.00 0.80 1.60 2.40 6.40 0.40 0.40 1.20 17 This document is authorized for use only in Dr. Kumail Rizvi's DXB/ MGB - June22/ Derivatives & Structured Products at S P Jain School of Global Management - Dubai from Nov 2022 to May 2023.292-140 Arundel Partners: The Sequel Project Exhibit 9 Summary Statistics for Samples of Films Released in 1987 and 19883 (dollar figures in millions) Table A 1987 Data First Film Hypothetical Sequel U.S. Distri- Distri- U.S. Distri- Distri Theater Other bution bution Negative Theater Other bution bution Negative Expense Revenue Fpes Revenue Fees Cost Rentals Expense Cost Rentals $31.8 Average (in 1901 $): $21.3 $84.4 $22.8 $21.5 $26.3 $14.9 $48.9 $17.0 $17.4 First Film Hypothetical Sequel PV of PV of PV of Net Negative One- PV of Net Negative One- Inflows at Cost at Year Inflows at Cost at Year Year 1 Year Return Year 4 Year 3 Return Average: $30.4 $25 8 0.71 $30.4 $33.8 0.01 $30.9 $22.3 0.04 $24.0 $20.3 0.32 Median $9.4 2.05 $29.4 $12.3 1.20 Standard deviation: Interquartile range: $11.1 $18.8 '0.80) $8.8 $24.6 (0.75 to to $52.1 $29.3 1.22 $40.2 $38.5 0.31 Table B 1988 Data First Film Hypothetical Sequel U.S. Distri- Distri- U.S. Distri- Distri- Negative Theater Other bution bution Negative Theater Other bution bution Rentals Revenue Fees Expens Cost Rentals Revenue Fees Expense Cost Average (in 1901 $): $19.7 $80.5 $21.3 $20.5 $24.4 $13.8 $46.1 $15.9 $18.7 $29.2 First Film Hypothetical Sequel PV of PV of PV of Net Negative One- PV of Net Negative One- inflows at Cost at Year Inflows at Cost at Year Year 1 Year 0 Return Year Year 3 Return Average $38.4 $23.8 0.48 $28.2 $31.3 (0.13 522.4 $20.3 0.01 $17.5 28.6 (0.40 Median: Standard deviation: 38.2 $11.4 1.37 $29.3 $14. 0.80 $9.3 $16.8 122 2 Interquartile range: (0.48) (0.89) to 10 to to to to $42.1 $24.8 0.93 $32 5 $32.5 1.14 aOne-year return is defined as: [PV of net inflows minus PV of negative cost] divided by [PV of negative cost] 18 This document is authorized for use only in Dr. Kumail Rizvi's DXB/ MGB - June22/ Derivatives & Structured Products at S P Jain School of Global Management - Dubai from Nov 2022 to May 2023.292-140 Arundel Partners: The Sequel Project Exhibit 1 Selected Motion Picture Industry Data, 1980-1991 North American Theatrical Film Rental Shares of Major Film Distributors ab 20th Metro Century Goldwyn MCA Warner Buena Total Sony Fox Mayer Paramount Universal Brothers Vista Orion Majors 1991 20% 12% 129% 11% 14% 14% 93% 1990 14 13 15 13 13 93 1989 16 7 14 17 1988 10 12 94 1987 9 9 87 1986 16 1985 20 NOWAGONONA 1984 21 10 1983 14 21 1982 10 14 1981 13 13 1980 14 18 Aggregate Box Office Data Number of Films Released in the U.S. and U.S. by Major and Independent Canada Distributors Gross Box Major Independent Office U.S. Rentals U.S. Average Theater Releases Releases (millions) (millions Ticket Price 1991 150 274 $4,803 $2, 160 $4.89 1990 158 221 5,022 2,260 4.75 1989 157 292 5,033 2,165 4.45 1988 153 319 4.458 1,920 4.11 1987 122 365 4,253 1,830 3.91 1986 133 286 3,778 1,650 3.71 1985 138 251 3,749 1,635 3.55 1984 152 258 4.031 1,800 3.38 1983 166 230 3,766 1,700 3.15 1982 150 211 3,453 1,555 2.94 1981 145 NA 2,967 1,33 2.78 1980 134 NA 2.749 1,235 2.69 Sources: Goldman Sachs Investment Research. Movie Industry Update 1982, MPAA, 1991 U.S. Economic Review, and industry sources. Several companies have undergone various transformations since 1980. The chart shows the company's current name. Includes re-releases of films that were first released in earlier years Includes films distributed by Columbia and Tri-Star. Tri-Star began operations in 1984. Buena Vista distributes films by The Walt Disney Company, and includes films produced by the Disney, Touchstone, and Hollywood Pictures studios. Excludes re-releases of films first issued in prior years. Excludes independent films. 8 This document is authorized for use only in Dr. Kumail Rizvi's DXB/ MGB - June22/ Derivatives & Structured Products at S P Jain School of Global Management - Dubai from Nov 2022 to May 2023.Arundel Partners: The Sequel Project 292-140 Exhibit 2 Revenue and Cost Estimates for "Typical" Film Distributed by a Major Studios,b (in millions of 1991 $) Percent of Percent of U.S. Theatrical Total Rentals Revenue Revenue Collected by Distributor U.S. theater rentals $10.0 100% 22% Non-U.S. theater rentals 9.0 90 19 Worldwide home video 15.0 150 32 Worldwide pay TV 5.5 55 12 Worldwide TVc 7.0 70 15 Total $ 46.5 465% 100% ibution Fees Worldwide theater $5.0 50% 11% Worldwide home video 4.0 40 Worldwide pay TV 1.5 15 3 Worldwide TV 20 20 4 Total $ 12.5 25% 27% Distribution Expenses Worldwide theater $12.0 120% 26% Worldwide home video 35 35 8 Worldwide p Worldwide TV Total $ 15.5 155% 33% Negative Costd Story rights/script development $0.5 Actors/director 6.0 Production management 1.0 Production crew 1.0 Set design/construction 2.0 Transportation/locations 1.5 Wardrobe/makeup/hair 0.5 Extras/props 0.5 Lighting 0.3 Special effects 0.3 Other principal photography 1.0 Film editing 0.7 MUSIC 0.4 Other postproduction 0.8 All other 1.5 Total negative cost $ 18.0 Pretax net profitse $ 0.5 aThe figures represent estimates of a typical film, not the average film. Fee structure assumes film is independently financed. In this chart, worldwide TV includes U.S. network, U.S. syndicated, and non-U.S. television. The negative cost breakdown is shown for illustrative purposes only, and provides one possible breakdown of a film's cost. Excludes interest charges. Assumes no gross participations. 9 This document is authorized for use only in Dr. Kumail Rizvi's DXB/ MGB - June22/ Derivatives & Structured Products at S P Jain School of Global Management - Dubai from Nov 2022 to May 2023
Step by Step Solution
There are 3 Steps involved in it
1 Expert Approved Answer
Step: 1 Unlock
Question Has Been Solved by an Expert!
Get step-by-step solutions from verified subject matter experts
Step: 2 Unlock
Step: 3 Unlock
Students Have Also Explored These Related Finance Questions!