

Question: Analysis for Cash Flow Statement about Centrica PLC (Include Introduction and conclusion) 0.6 0.4 0.3 0.5 Operating 0.3 Cash Flow Ratio Cash interest 0.9 coverage
Analysis for Cash Flow Statement about Centrica PLC
(Include Introduction and conclusion)
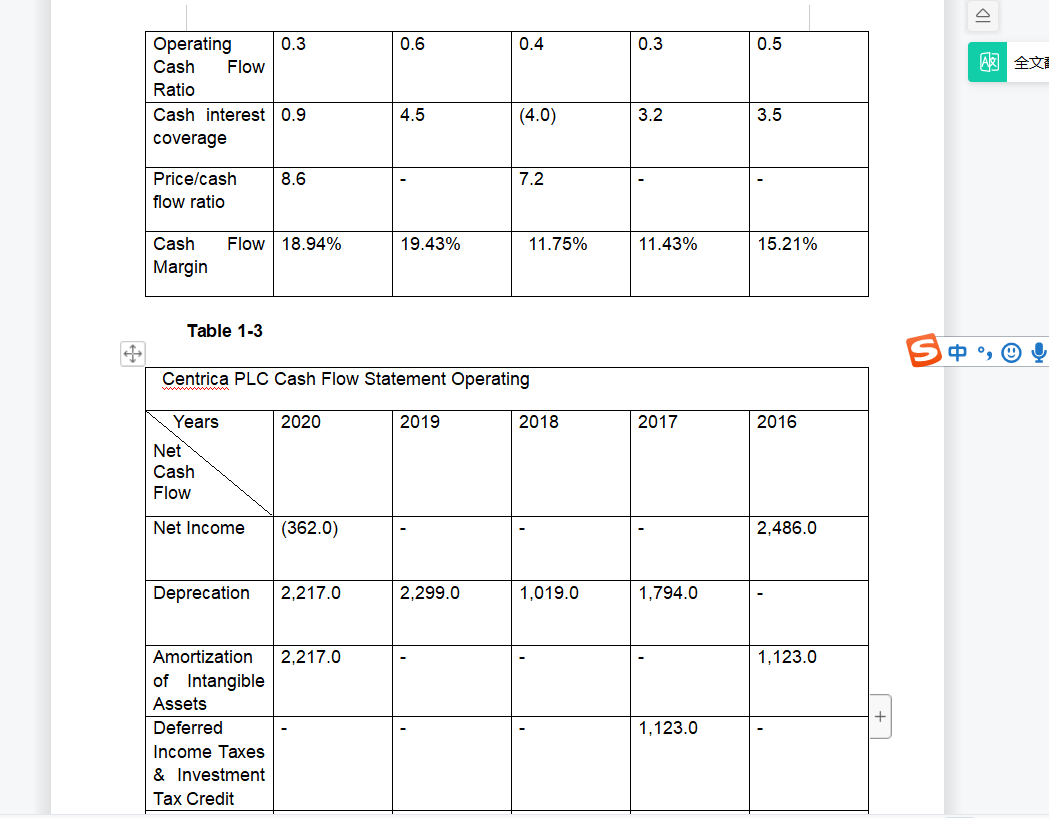
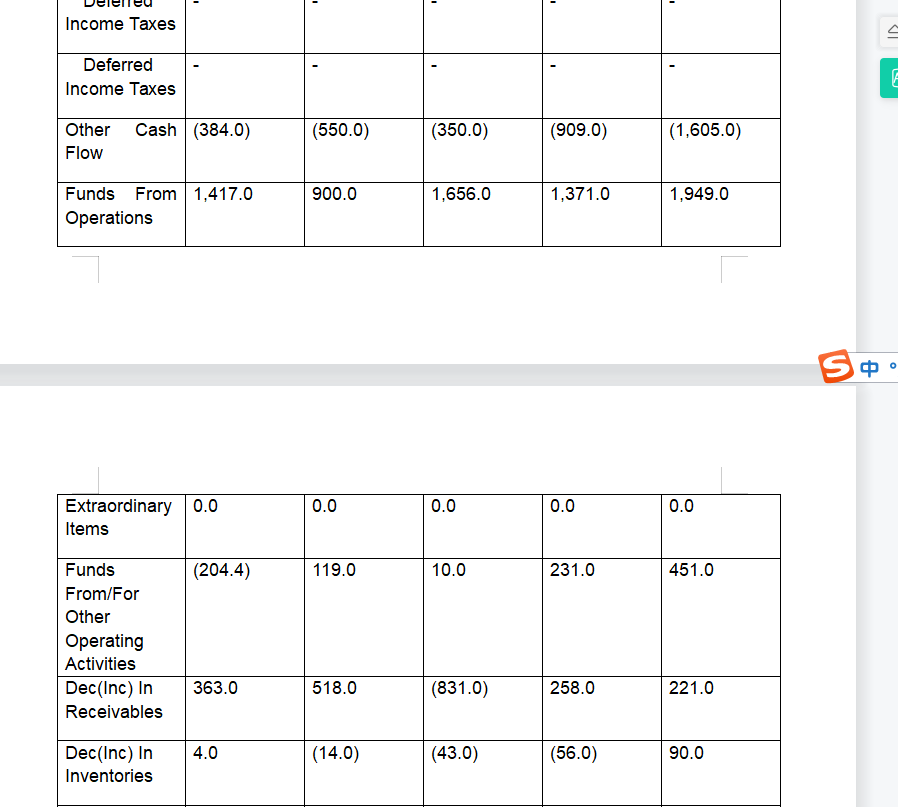
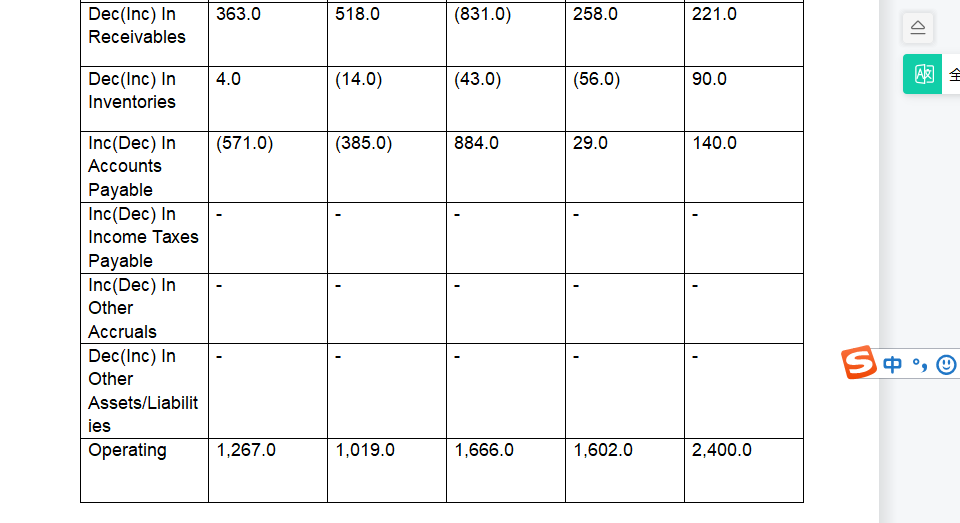
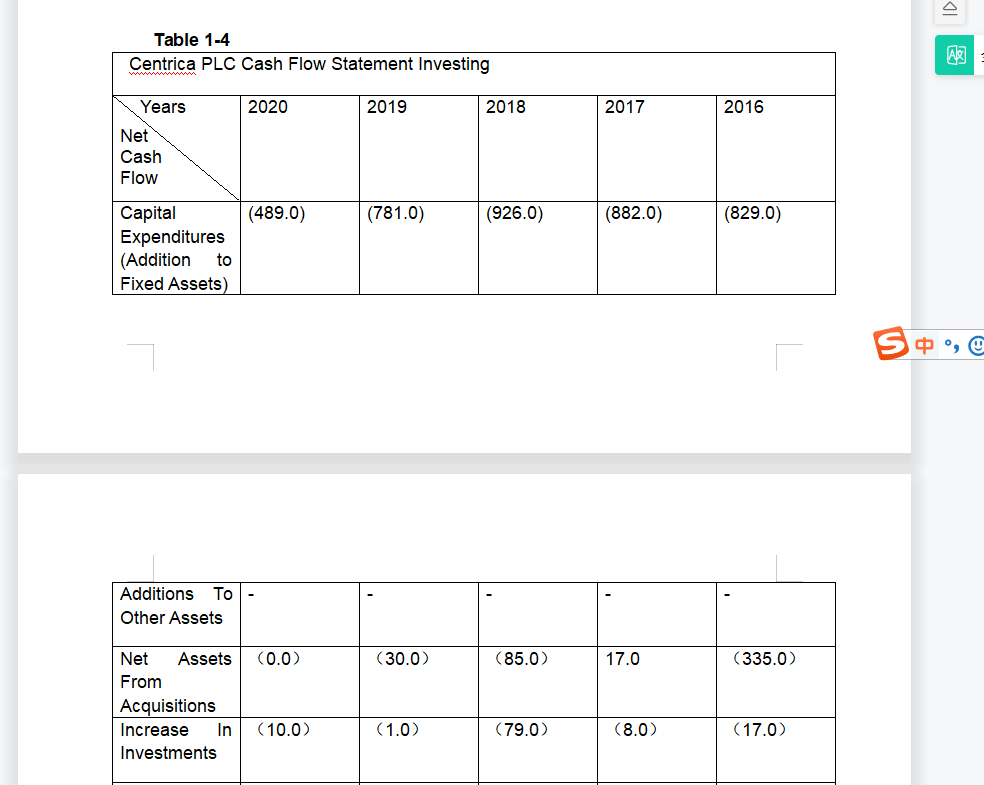
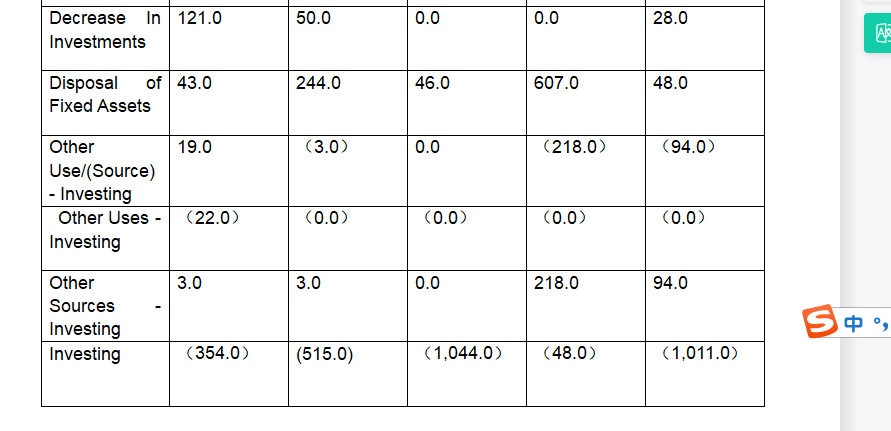
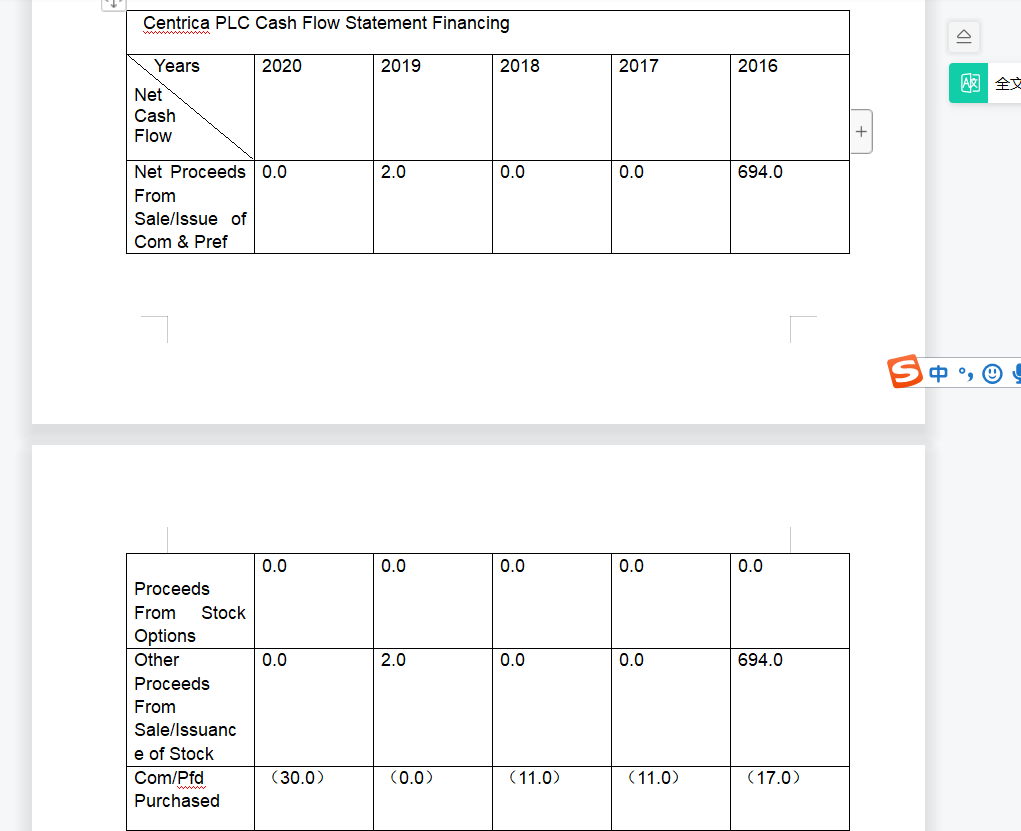
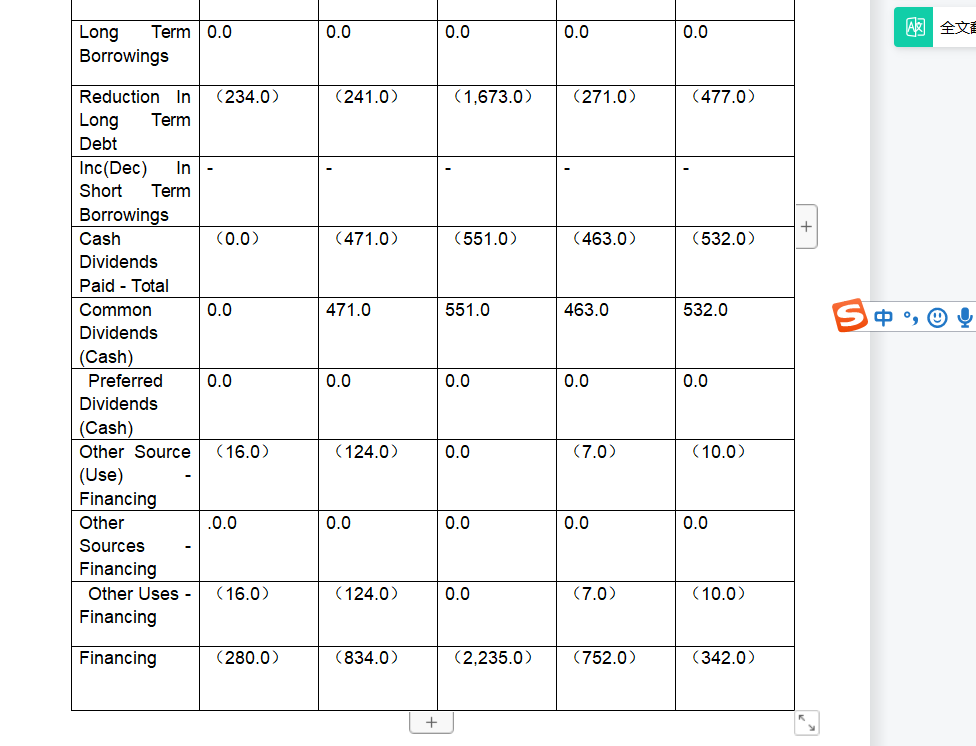
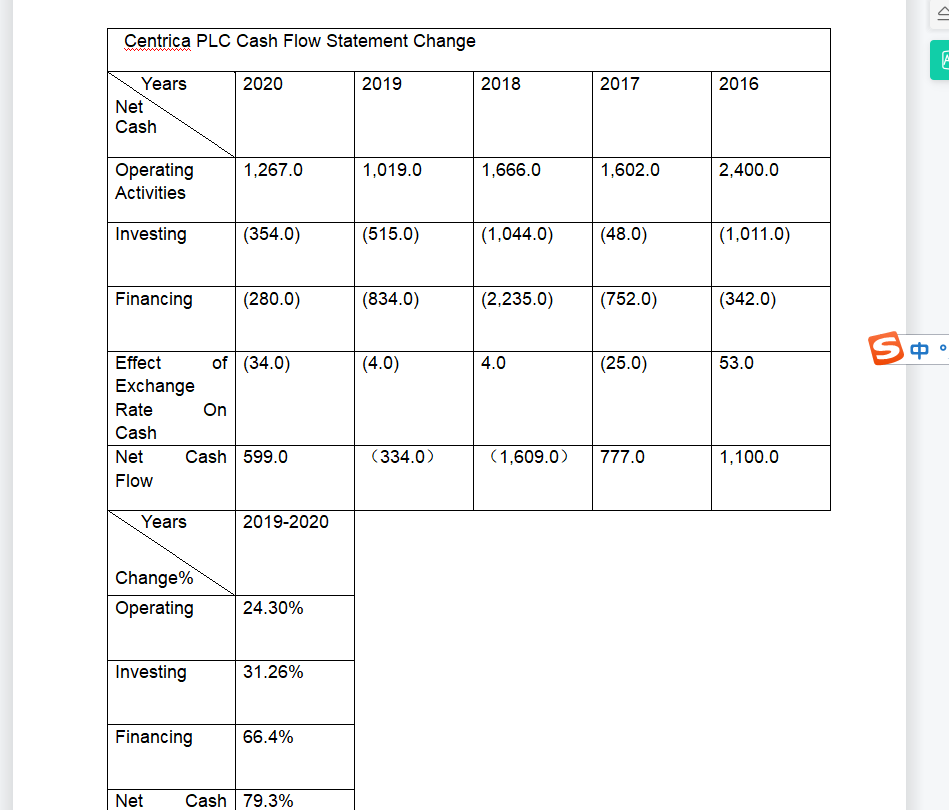
0.6 0.4 0.3 0.5 Operating 0.3 Cash Flow Ratio Cash interest 0.9 coverage 4.5 (4.0) 3.2 3.5 8.6 7.2 Price/cash flow ratio Flow 18.94% 19.43% 11.75% 11.43% 15.21% Cash Margin Table 1-3 S , ! Centrica PLC Cash Flow Statement Operating Years 2020 2019 2018 2017 2016 Net Cash Flow Net Income (362.0) 2,486.0 Deprecation 2.217.0 2.299.0 1,019.0 1,794.0 2.217.0 1,123.0 Amortization of Intangible Assets Deferred Income Taxes & Investment Tax Credit 1,123.0 - - - - Income Taxes Deferred Income Taxes E (550.0) (350.0) Other Cash (384.0) Flow (909.0) (1.605.0) 900.0 1,656.0 1,371.0 1,949.0 Funds From 1,417.0 Operations S o 0.0 0.0 0.0 0.0 Extraordinary 0.0 Items (204.4) 119.0 10.0 231.0 451.0 Funds From/For Other Operating Activities Dec(Inc) In Receivables 363.0 518.0 (831.0) 258.0 221.0 4.0 (14.0) (43.0) (56.0) 90.0 Dec(Inc) In Inventories 363.0 518.0 (831.0) 258.0 221.0 Dec(Inc) In Receivables 4.0 (14.0) (43.0) (56.0) 90.0 Dec(Inc) In Inventories Ag] (571.0) (385.0) 884.0 29.0 140.0 Inc(Dec) In Accounts Payable Inc(Dec) In Income Taxes Payable Inc(Dec) In Other Accruals Dec(Inc) In Other Assets/Liabilit ies Operating S , 1,267.0 1,019.0 1,666.0 1,602.0 2,400.0 ol Table 1-4 Centrica PLC Cash Flow Statement Investing A3 2020 2019 2018 2017 2016 Years Net Cash Flow (489.0) (781.0) (926.0) (882.0) (829.0) Capital Expenditures (Addition to Fixed Assets) S C Additions Other Assets (0.0) (30.0) (85.0) 17.0 (335.0) Net Assets From Acquisitions Increase In Investments (10.0) (1.0) (79.0) (8.0) (17.0) 50.0 0.0 0.0 28.0 Decrease in 121.0 Investments AC 244.0 46.0 607.0 48.0 Disposal of 43.0 Fixed Assets 19.0 (3.0) 0.0 (218.0) (94.0) Other Use/(Source) - Investing Other Uses - Investing (22.0) (0.0) (0.0) (0.0) (0.0) 3.0 3.0 0.0 218.0 94.0 Other Sources Investing Investing + (354.0) (515.0) (1,044.0) (48.0) (1,011.0) Centrica PLC Cash Flow Statement Financing Years 2020 2019 2018 2017 2016 Net Cash Flow + 2.0 0.0 0.0 694.0 Net Proceeds 0.0 From Sale/Issue of Com & Pref s @ 0.0 0.0 0.0 0.0 0.0 0.0 2.0 0.0 0.0 694.0 Proceeds From Stock Options Other Proceeds From Sale/Issuanc e of Stock Com/Pfd Purchased (30.0) (0.0) (11.0) (11.0) (17.0) 0.0 0.0 0.0 0.0 Long Term 0.0 Borrowings (234.0) (241.0) (1,673.0) (271.0) (477.0) + (0.0) (471.0) (551.0) (463.0) (532.0) 0.0 471.0 551.0 463.0 532.0 S , ! Reduction In Long Term Debt Inc(Dec) In Short Term Borrowings Cash Dividends Paid - Total Common Dividends (Cash) Preferred Dividends (Cash) Other Source (Use) Financing Other Sources Financing Other Uses - Financing 0.0 0.0 0.0 0.0 0.0 (16.0) (124.0) 0.0 (7.0) (10.0) .0.0 0.0 0.0 0.0 0.0 (16.0) (124.0) 0.0 (7.0) (10.0) Financing (280.0) (834.0) (2,235.0) (752.0) (342.0) + Centrica PLC Cash Flow Statement Change 2020 2019 2018 2017 2016 Years Net Cash 1,267.0 1,019.0 1,666.0 1,602.0 2,400.0 Operating Activities Investing (354.0) (515.0) (1,044.0) (48.0) (1,011.0) Financing (280.0) (834.0) (2.235.0) (752.0) (342.0) Soo (4.0) 4.0 (25.0) 53.0 Effect of (34.0) Exchange Rate On Cash Net Cash 599.0 Flow (334.0) (1,609.0) 777.0 1,100.0 Years 2019-2020 Change Operating 24.30% Investing 31.26% Financing 66.4% Net Cash 79.3%
Step by Step Solution
There are 3 Steps involved in it

Get step-by-step solutions from verified subject matter experts