

Question: Analysis of Carbig.mat Assign Part 2 Assignment Create a section to analyze a portion of the data Goal is to create two scatter plots and
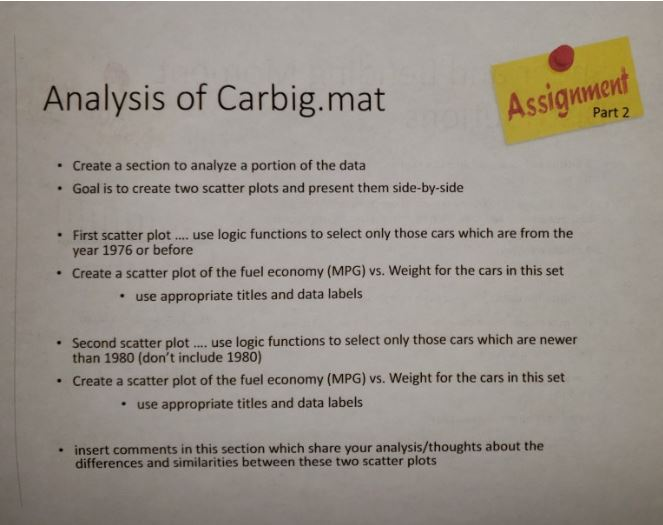
Analysis of Carbig.mat Assign Part 2 Assignment Create a section to analyze a portion of the data Goal is to create two scatter plots and present them side-by-side . First scatter plot .... use logic functions to select only those cars which are from the year 1976 or before Create a scatter plot of the fuel economy (MPG) vs. Weight for the cars in this set use appropriate titles and data labels Second scatter plot .... use logic functions to select only those cars which are newer than 1980 (don't include 1980) Create a scatter plot of the fuel economy (MPG) vs. Weight for the cars in this set use appropriate titles and data labels insert comments in this section which share your analysis/thoughts about the differences and similarities between these two scatter plots
Step by Step Solution
There are 3 Steps involved in it

Get step-by-step solutions from verified subject matter experts