

Question: ANALYSIS OF INFORMATION A 2 3 4 5 6 7 8 9 10 11 12 13 14 15 16 17 18 19 20 21 22
ANALYSIS OF INFORMATION
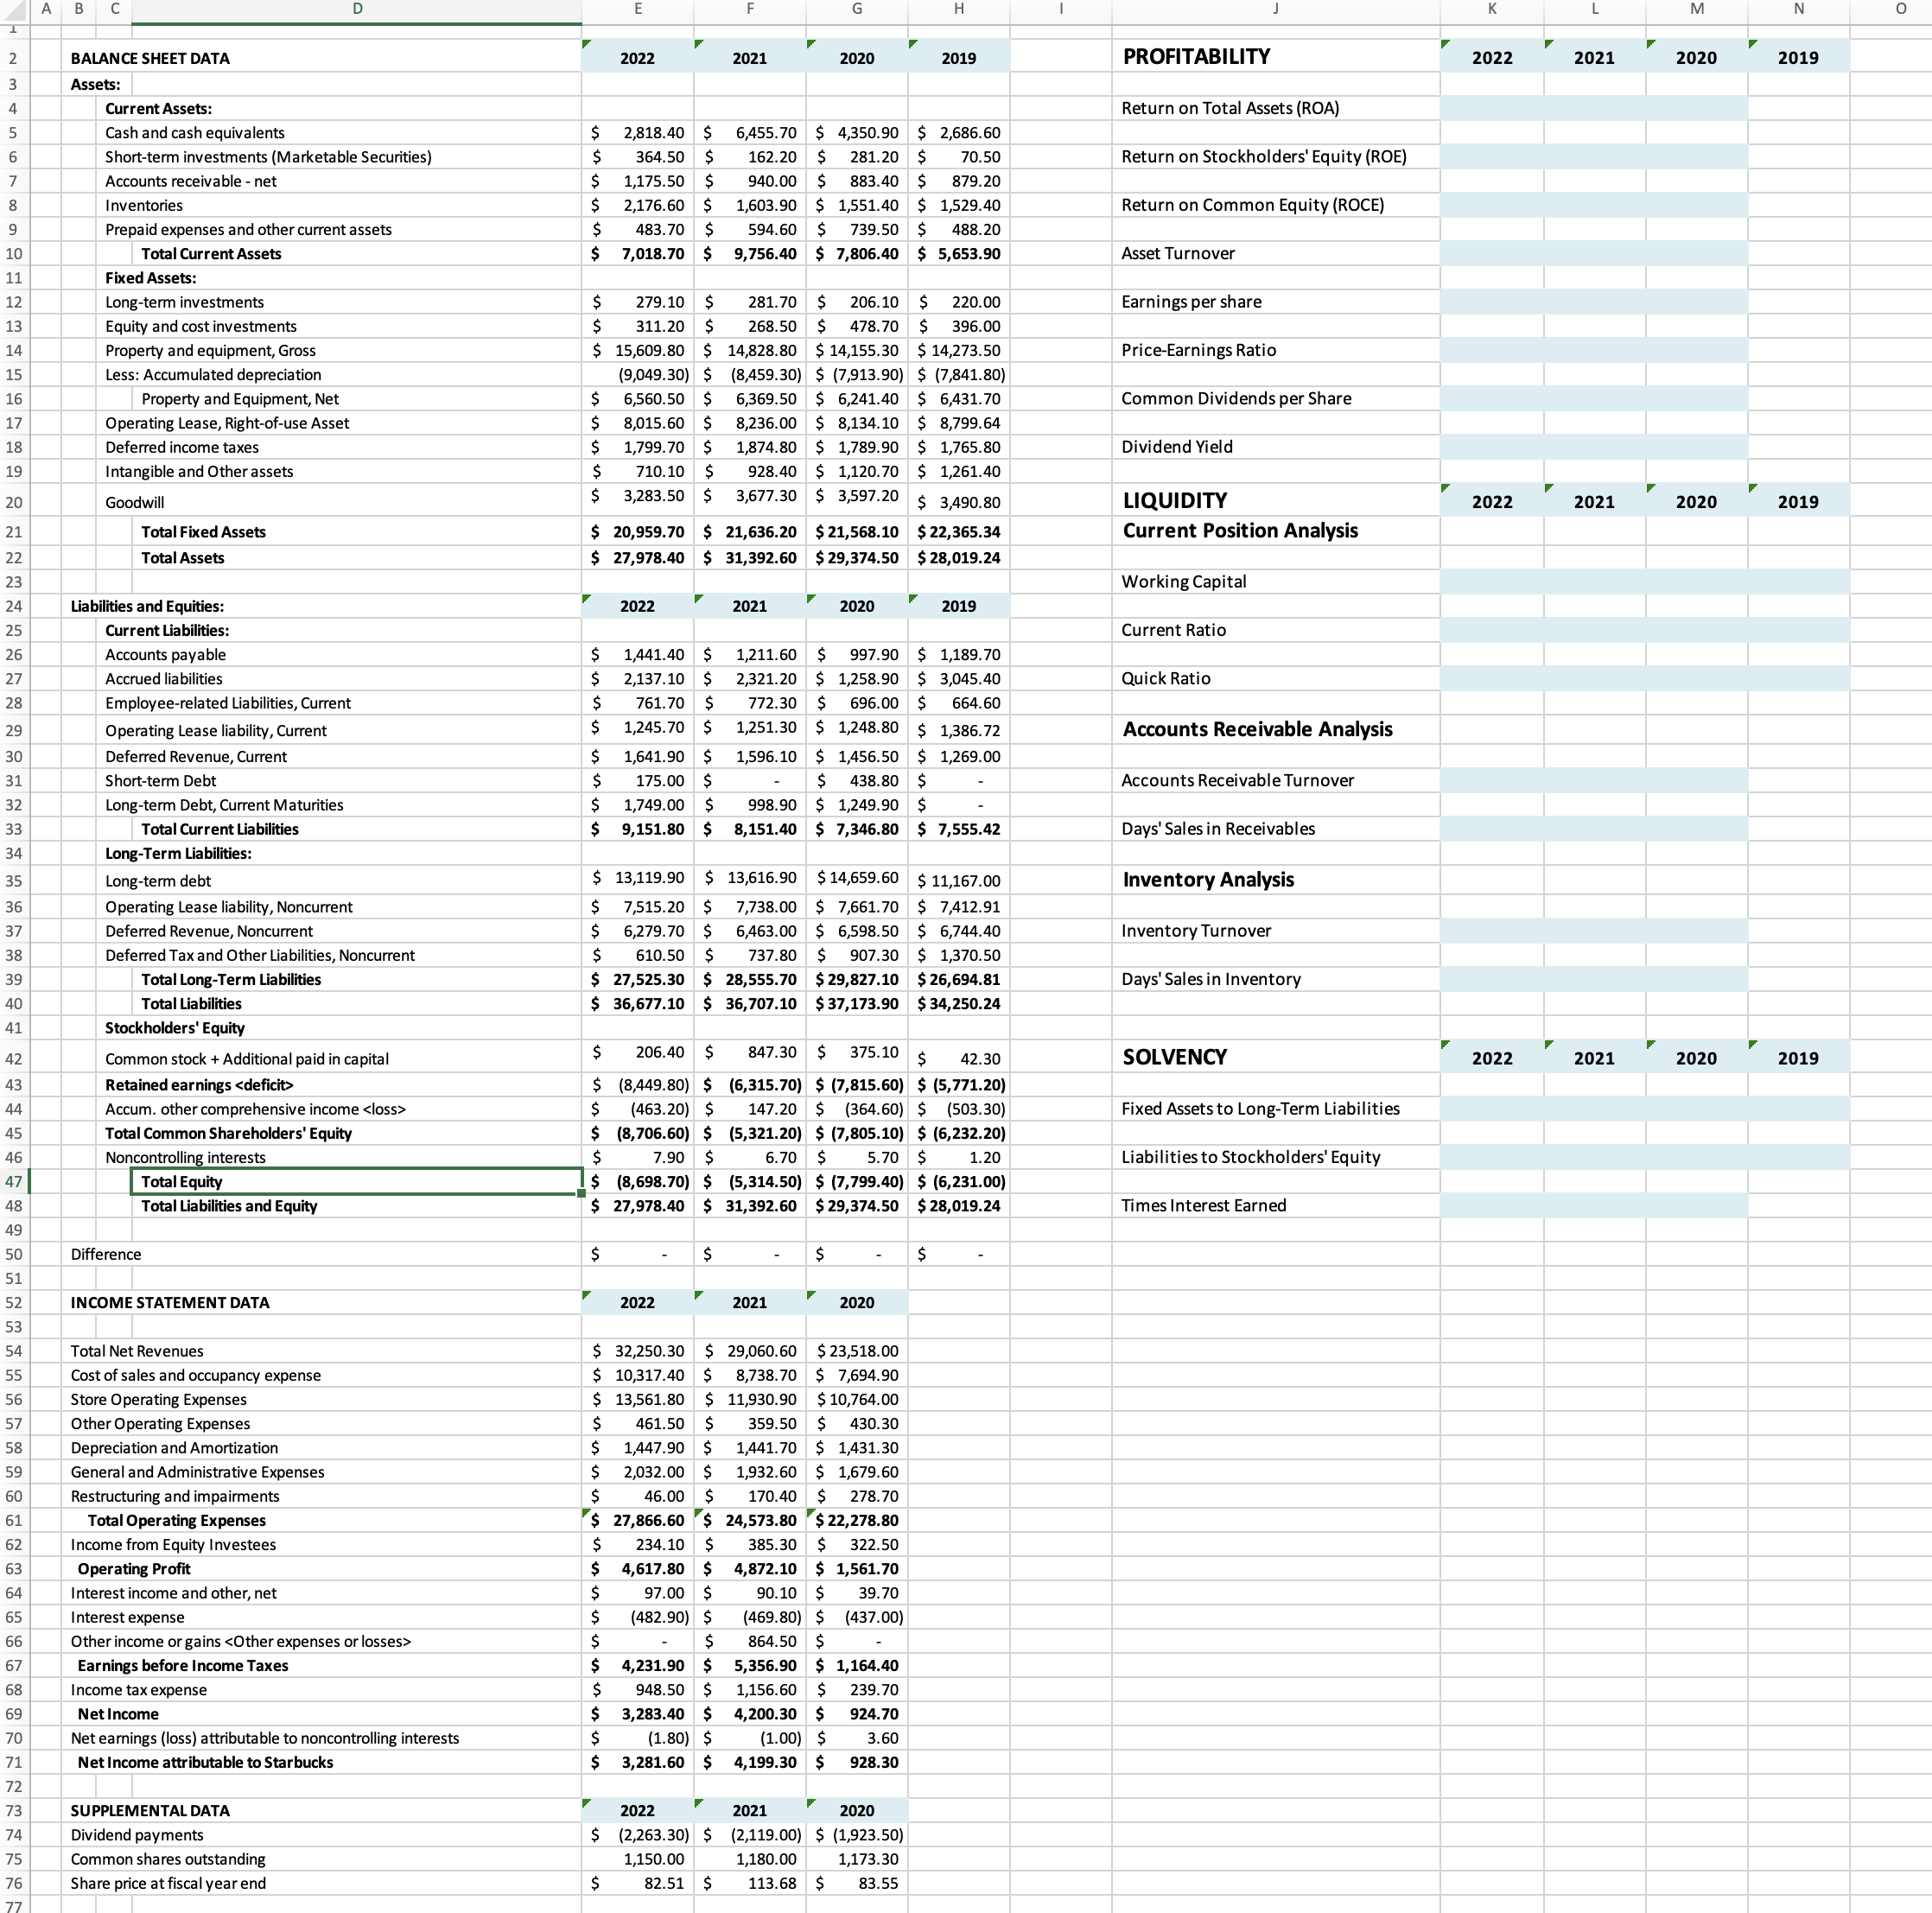
A 2 3 4 5 6 7 8 9 10 11 12 13 14 15 16 17 18 19 20 21 22 23 24 25 26 27 28 29 30 31 32 33 34 35 36 37 38 39 41 42 43 45 46 47 49 50 51 52 53 54 55 56 57 58 59 60 61 62 63 64 65 66 67 68 69 70 71 72 73 74 75 76 B c O BALANCE SHEET DATA Cur rent Assets: Cash and cash equivalents Short-term investments (Marketable Securities) Accounts receivable - net Inventories Prepaid expenses and other current assets Total Current Assets Fixed Assets: Long-term investments Equity and cost investments Property and equipment, Gross Less: Accumulated depreciation Property and Equipment, Net Operating Lease, Right-of-use Asset Deferred income taxes Intangible and Other assets Goodwill Total Fixed Assets Total Assets Liabilities and Equities: Current Liabilities: Accounts payable Accrued liabilities Employee-related Liabilities, Current Operating Lease liability, Current Deferred Revenue, Current Short-term Debt Long-term Debt, Current Maturities Total Current Liabilities Long-Term Liabilities: Long-term debt Operating Lease liability, Noncurrent Deferred Revenue, Noncurrent Deferred Tax and Other Liabilities, Noncurrent Total Long-Term Liabilities Total Liabilities Stockholders' Equity Common stock + Additional paid in capital Retained earnings Accum. other comprehensive income Total Common Shareholders' Equity Noncontrollin interests Total Equity Total Liabilities and Equity Difference INCOME STATEMENT DATA Total Net Revenues Cost of sales and occupancy expense Store Operating Expenses Other Operating Expenses Depreciation and Amortization General and Administrative Expenses Restructuring and impairments Total Operating Expenses Income from Equity Investees Operating Profit Interest income and other, net Interest expense Other income or gains Earnings before Income Taxes I ncome tax expense Net I ncome Net eamings (loss) attributable to noncontrolling interests Net I ncome attributable to Starbucks SUPPLEMENTAL DATA Dividend payments Common shares outstanding Share price at fiscal year end 2022 2,818.40 364.50 1,175.50 2,176.60 483.70 7,018.70 279.10 311.20 15,609.80 (9,049.30) 6,560.50 8,015.60 1,799.70 710.10 3,283.50 20,959.70 27,978.40 2022 1,441.40 2,137.10 761.70 1,245.70 1,641.90 175.00 1,749.00 9,151.80 13,119.90 7,515.20 6,279.70 610.50 27,525.30 36,677.10 206.40 (8,449.80) (463.20) (8,706.60) $ (8,698.70) $ 27,978.40 2022 32,250.30 10,317.40 13,561.80 461.50 1,447.90 2,032.00 46.00 27,866.60 234.10 4,617.80 97.00 (482.90) 4,231.90 948.50 3,283.40 (1.80) 3,281.60 2022 (2,263.30) 1,150.00 82.51 2021 6,455.70 162.20 940.00 1,603.90 594.60 9,756.40 281.70 268.50 14,828.80 (8,459.30) 6,369.50 8,236.00 1,874.80 928.40 3,677.30 21,636.20 31,392.60 2021 1,211.60 2,321.20 772.30 1,251.30 1,596.10 998.90 8,151.40 13,616.90 7,738.00 6,463.00 737.80 28,555.70 36,707.10 847.30 (6,315.70) 147.20 (5,321.20) 2020 4,350.90 281.20 883.40 1,551.40 739.50 7,806.40 206.10 478.70 $ 14,155.30 $ (7,913.90) 6,241.40 8,134.10 1,789.90 1,120.70 3,597.20 $21,568.10 $29,374.50 2020 997.90 1,258.90 696.00 1,248.80 1,456.50 438.80 1,249.90 7,346.80 $ 14,659.60 $ 7,661.70 $ 6,598.50 $ 907.30 $29,827.10 $ 37,173.90 $ 375.10 $ (7,815.60) $ (7,805.10) 2019 2,686.60 70.50 879.20 1,529.40 488.20 5,653.90 220.00 396.00 $ 14,273.50 $ (7,841.80) 6,431.70 8,799.64 1,765.80 1,261.40 3,490.80 $ 22,365.34 $ 28,019.24 2019 1,189.70 3,045.40 664.60 1,386.72 1,269.00 7,555.42 $ 11,167.00 $ 7,412.91 $ 6,744.40 $ 1,370.50 $ 26,694.81 $ 34,250.24 42.30 $ (5,771.20) $ (364.60)$ (503.30) $ (6,232.20) PROFITABILITY Return on Total Assets (ROA) Return on Stockholders' Equity (ROE) Return on Common Equity (ROCE) Asset Turnover Earnings per share Price-Earnings Ratio Common Dividends per Share Dividend Yield LIQUIDITY Current Position Analysis Working Capital Current Ratio Quick Ratio Accounts Receivable Analysis Accounts Receivable Turnover Days' Sales in Receivables Inventory Analysis Inventory Turnover Days' Sales in Inventory SOLVENCY Fixed Assets to Long-Term Liabilities Liabilities to Stockholders' Equity Times Interest Earned 2022 2022 2022 2021 2021 2021 2020 2020 2020 2019 2019 2019 1.20 (5,314.50) $ (7,799.40) $ (6,231.00) 31,392.60 2021 29,060.60 8,738.70 11,930.90 359.50 1,441.70 1,932.60 170.40 24,573.80 385.30 4,872.10 90.10 (469.80) 864.50 5,356.90 1,156.60 4,200.30 (1.00) 4,199.30 2021 (2,119.00) 1,180.00 113.68 $29,374.50 $28,019.24 2020 $ 23,518.00 $ 7,694.90 $ 10,764.00 $ 430.30 $ 1,431.30 $ 1,679.60 $ 278.70 ' $ 22,278.80 322.50 1,561.70 39.70 (437.00) 1,164.40 239.70 924.70 3.60 928.30 2020 $ (1,923.50) 1,173.30 83.55
Step by Step Solution
There are 3 Steps involved in it

Get step-by-step solutions from verified subject matter experts