

Question: Analysis question: Ratio Analysis : Liquidity , profitability, Efficiency , Gearing , Market ration . 1) Literature review : search of definition and techniques about
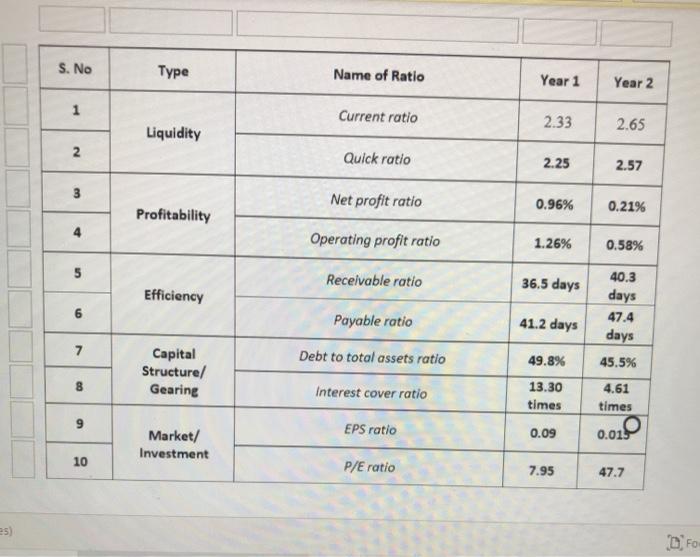
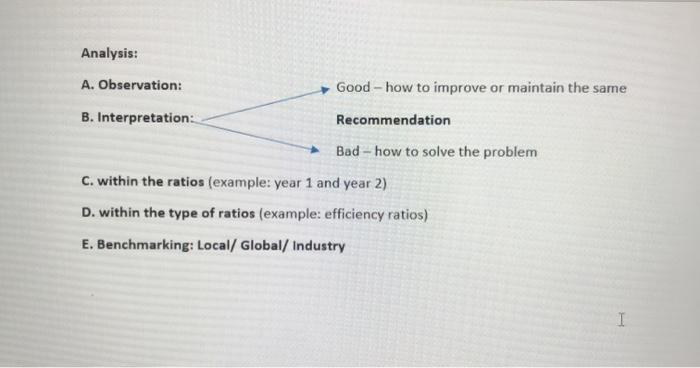
B: Perform Comparative Analysis: Based on the above calculation results and literature review from e-resources about ratio analysis techniques; critically analyze the liquidity, profitability, Efficiency, gearing and market ratios of the selected company including comparison of both years with competitors in industry/market. Support your analysis with necessary graphs, figures and literature review. (Minimum 5 citations.) (Marks 25) Review of literature about ratios used in the calculations and about the technique of 'ratio analysis'. Analysis based on calculations and with LR (Specific LR to be used for benchmarking/ comparison with similar industry across the globe/GCC etc and use figures/ graphs to support your analysis) . Examples of graphs/ diagrams/figures that could be used to support the analysis are given below for your reference. You may use any graphs/diagrams/figures that is suitable and relevant for the particular data S. No Type Name of Ratio Year 1 Year 2 1 1 Current ratio 2.33 2.65 Liquidity N Quick ratio 2.25 2.57 3 Net profit ratio 0.96% 0.21% Profitability 4 Operating profit ratio 1.26% 0.58% 5 Receivable ratio 36.5 days Efficiency 40.3 days 47.4 days 6 Payable ratio 41.2 days 7 Debt to total assets ratio 49.8% 45.5% Capital Structure/ Gearing co Interest cover ratio 13.30 times 4.61 times 9 EPS ratio 0.09 Market/ Investment 0.020 10 P/E ratio 7.95 47.7 D.FO Analysis: A. Observation: Good - how to improve or maintain the same B. Interpretation: Recommendation Bad - how to solve the problem C. within the ratios (example: year 1 and year 2) D. within the type of ratios (example: efficiency ratios) E. Benchmarking: Local/Global/ Industry
Step by Step Solution
There are 3 Steps involved in it

Get step-by-step solutions from verified subject matter experts