

Question: Analysis the data according to this with graphical presentation and Write explanation with every step. The table below shows the defects from XYZ garments factory.
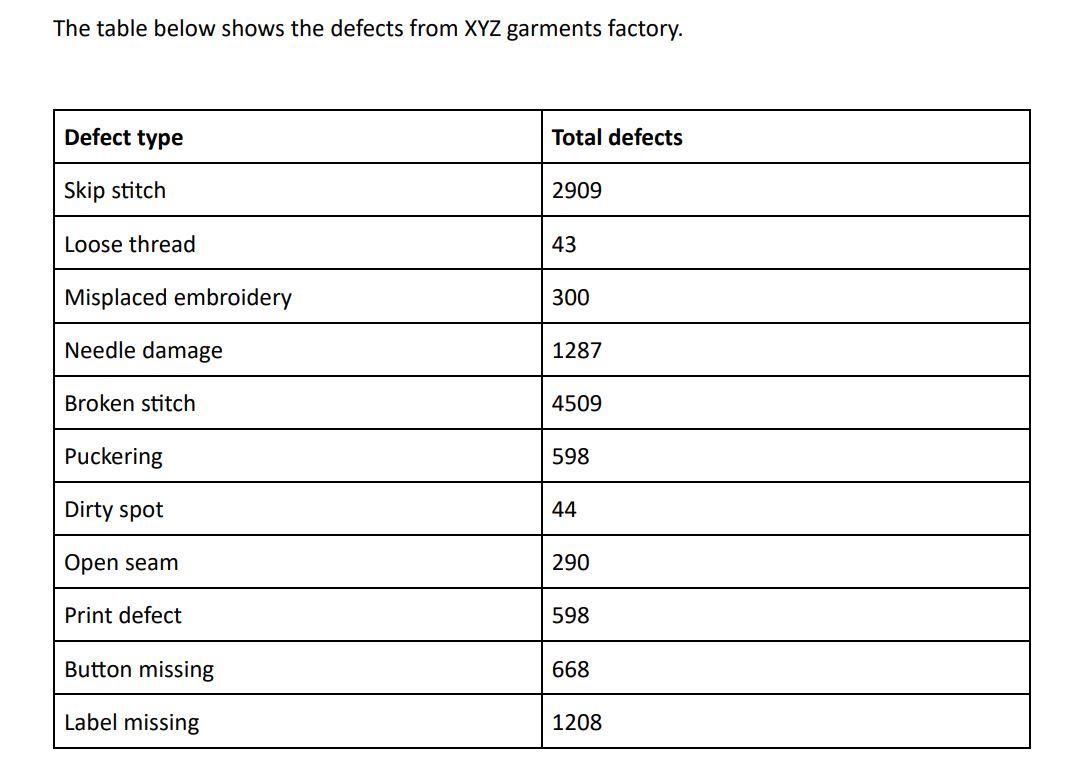 Analysis the data according to this with graphical presentation and Write explanation with every step.
Step by Step Solution
There are 3 Steps involved in it
1 Expert Approved Answer
Step: 1 Unlock

Question Has Been Solved by an Expert!
Get step-by-step solutions from verified subject matter experts
Step: 2 Unlock
Step: 3 Unlock