

Question: Analysis the financial ratio based on the data given.(Compare and constant both company)Sime Darby plantation and ioi corporation Financial analysis2.1 ProfitabilityOPM, GPM, ROCE 2.2 Liquidity
Analysis the financial ratio based on the data given.(Compare and constant both company)Sime Darby plantation and ioi corporation Financial analysis2.1 ProfitabilityOPM, GPM, ROCE 2.2 Liquidity Current ratioQuick ratio2.3 EfficiencyReceivables days Payables days Inventory days Assets turnover2.4 LeverageGearingDebt-to-equity ratio2.5 Investor ratios EPSP/E ratio
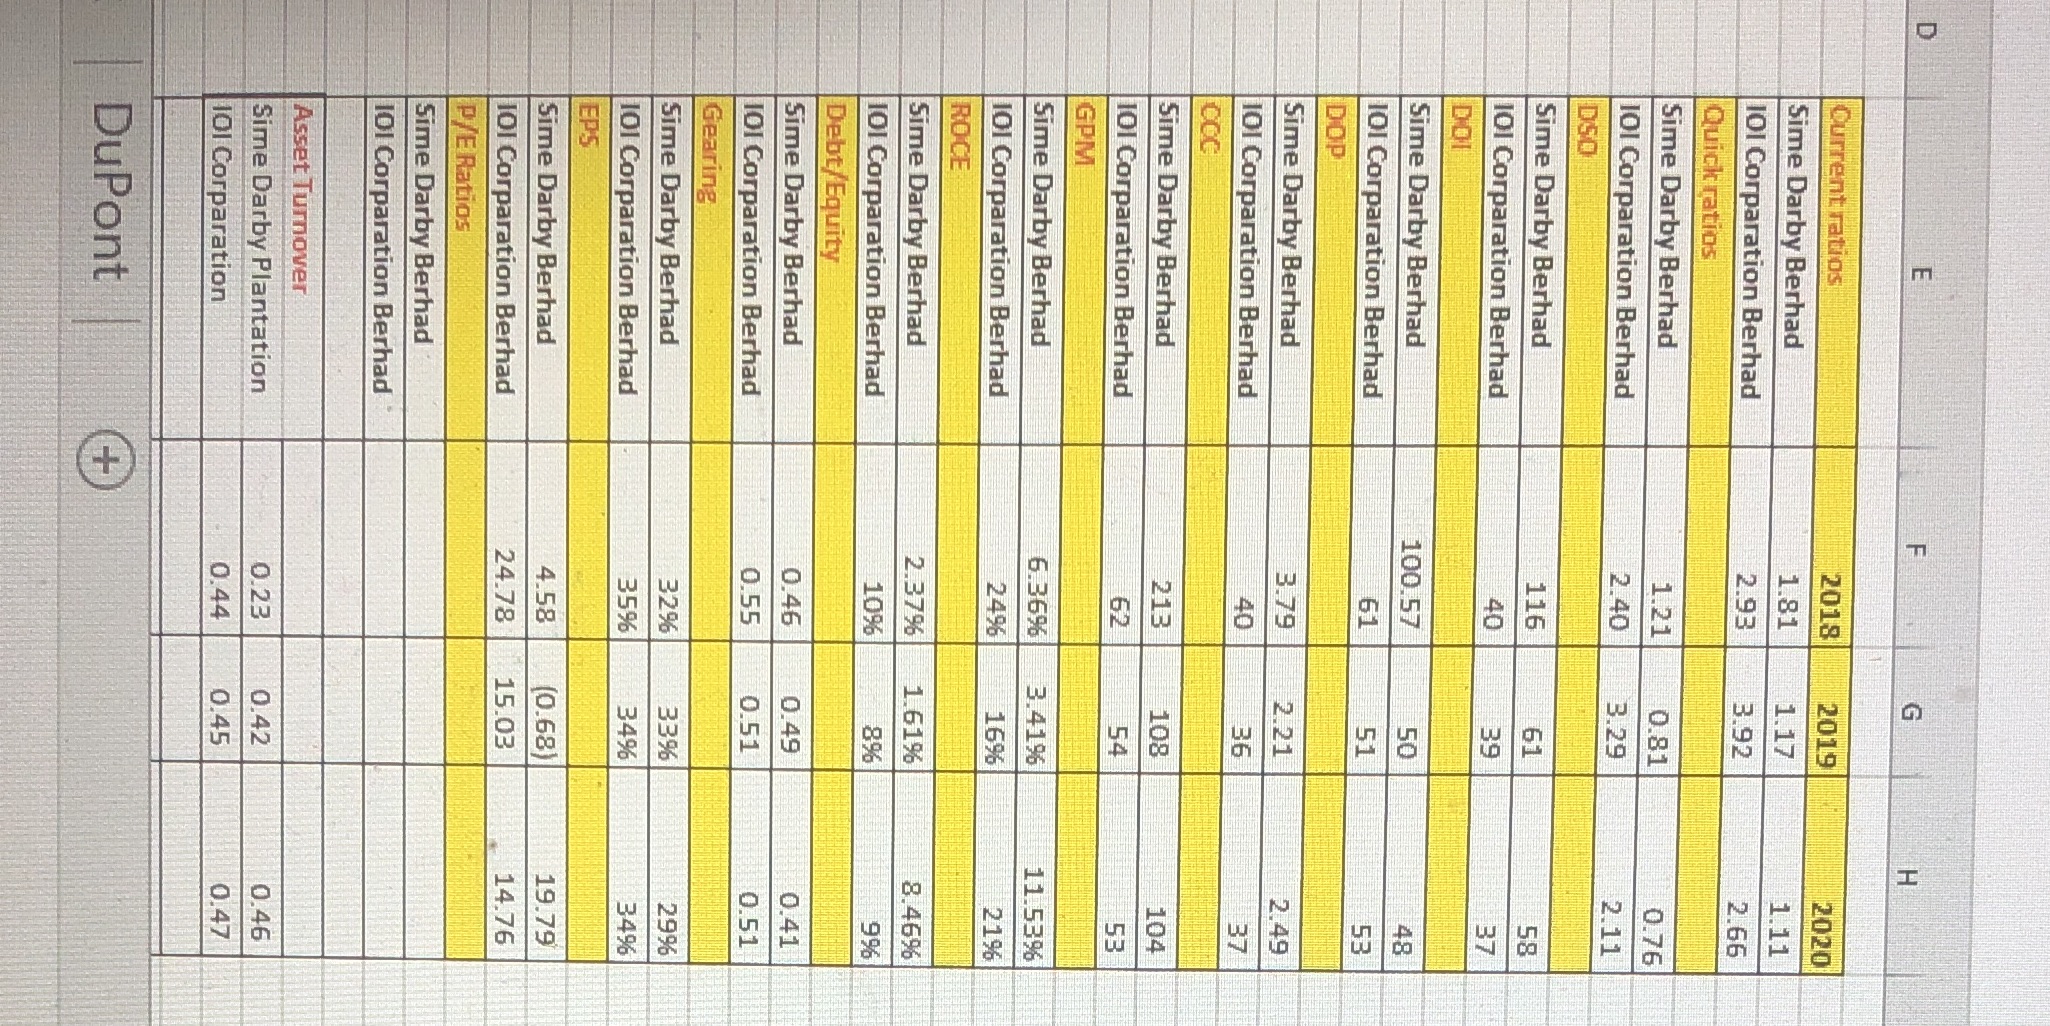
Current ratios 2018 2019 2020 Sime Darby Berhad 1.81 1.17 1.11 101 Corparation Berhad 2.93 3.92 2.66 Quick ratios Sime Darby Berhad 1.21 0.81 0.76 101 Corparation Berhad 2.40 3.29 2.11 D50 Sime Darby Berhad 116 To m 101 Corparation Berhad m DOI Sime Darby Berhad 100.57 101 Corparation Berhad DOP Sime Darby Berhad 3.79 2.21 2.49 101 Corparation Berhad COC Sime Darby Berhad 213 108 104 101 Corparation Berhad GPM Sime Darby Berhad 6.36% 3.41% 11.53% 101 Corparation Berhad 24% 16% 21% ROCE Sime Darby Berhad 2.37% 1.61% 8.46% 101 Corparation Berhad 10% 8% 9% Debt/Equity Sime Darby Berhad 0.46 0.49 0.41 IO1 Corparation Berhad 0.55 0.51 0.51 Gearing Sime Darby Berhad 32% 33% 29% 101 Corparation Berhad 35% 34% 34% EPS Sime Darby Berhad 4.58 (0.68) 19.79 101 Corparation Berhad 24.78 15.03 14.76 P/E Ratios Sime Darby Berhad 101 Corparation Berhad Asset Turnover Sime Darby Plantation 0.23 0.42 0.46 101 Corparation 0.44 0.45 0.47 DuPont +
Step by Step Solution
There are 3 Steps involved in it

Get step-by-step solutions from verified subject matter experts