

Question: Analytical Assignment The analytical portion of the case assignment should be completed in the excel template which can be found in Canvas. 1. Plot in

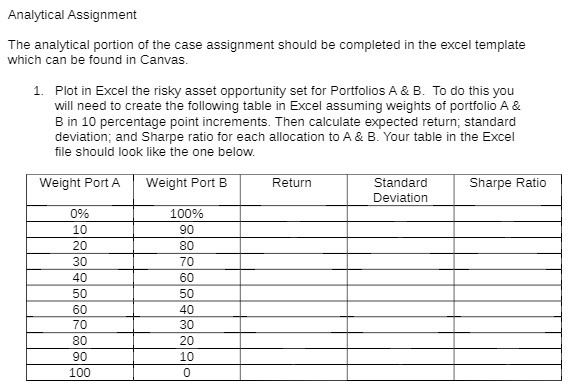
Analytical Assignment The analytical portion of the case assignment should be completed in the excel template which can be found in Canvas. 1. Plot in Excel the risky asset opportunity set for Portfolios A & B. To do this you will need to create the following table in Excel assuming weights of portfolio A & B in 10 percentage point increments. Then calculate expected return; standard deviation; and Sharpe ratio for each allocation to A & B. Your table in the Excel file should look like the one below. Weight Port A Weight Port B Return Standard Sharpe Ratio 0% Deviation 100% 10 90 20 80 30 70 40 60 50 50 60 40 70 30 80 20 90 10 100 0
Step by Step Solution
There are 3 Steps involved in it
1 Expert Approved Answer
Step: 1 Unlock

Question Has Been Solved by an Expert!
Get step-by-step solutions from verified subject matter experts
Step: 2 Unlock
Step: 3 Unlock