Question: Analytics, Business Intelligence, and Clinical Intelligence. Required: 1. Read and review Chapter 11: Analytics, Business Intelligence, and Clinical Intelligence, including Figure 11.1 Relationship of Complexity
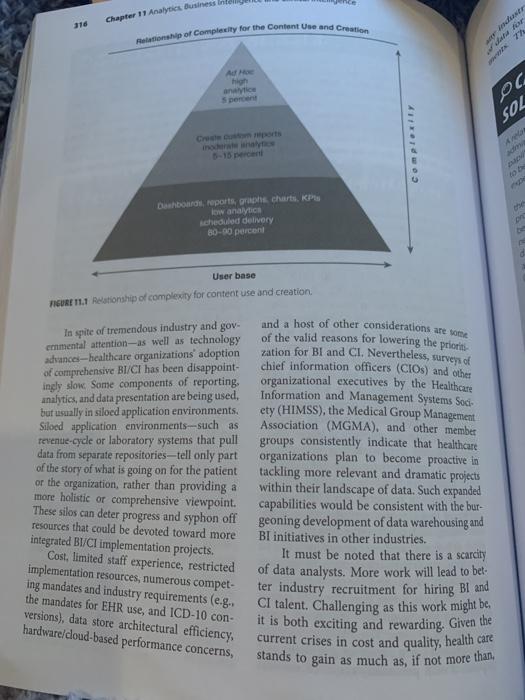
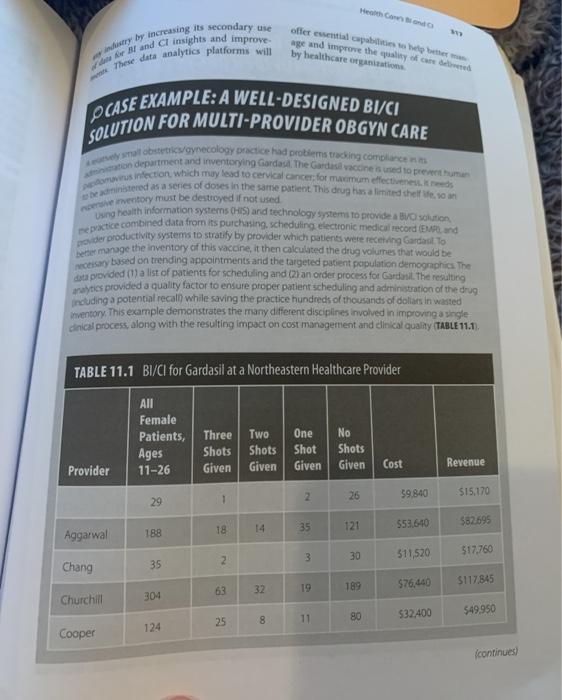
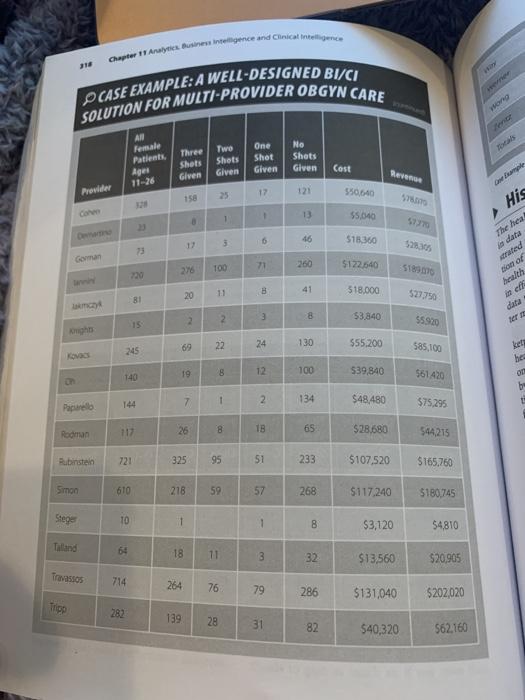
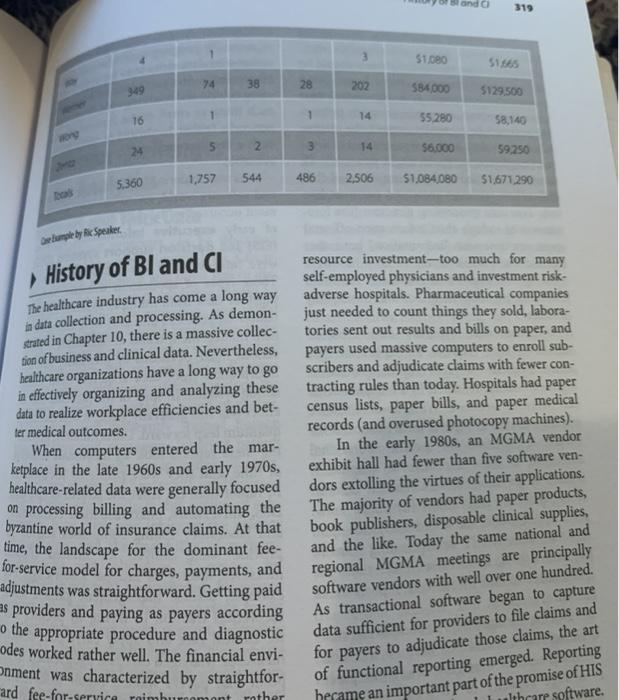
Analytics, Business Intelligence, and Clinical Intelligence. Required: 1. Read and review Chapter 11: Analytics, Business Intelligence, and Clinical Intelligence, including Figure 11.1 Relationship of Complexity for Content Use and Creation and Case Example: A Well-designed BI/CI Solution Multi-provider OBGYN Care. 2. Describe and interpret Figure 11.1. 3. What surprises you about this figure, and what does this tell you about the adoption of analytics, BI, and Cl within healthcare organizations? 4. Where does Case Example: A Well-designed BI/CI Solution for Multi-provider OBGYN Care fit within Figure 11.1? Why? Your answer should be at least 700 words (without title page and references) and a maximum of 1200 words. Please add references to your work. You cannot give a one-line answer to questions in the assignment. Do not forget to explain your rationale behind your answer. Health Care Bando 315 includes repon ation "CI ing NOT were designed for a A man and breadth of purpose wanatans have achieved marked Co where data have been con Als and where either an IT OF durment has restricted use of those #choren few parties, there have been Nackers for vendors and for BI/CI s Expectations often are not met by outcomes of those projects expectations we inflated due to the vendor overselling methods, an organization misunderstand- the level of expertise, investment and commitment necessary or both parties fail to appreciate the complexity of BI/CL. "We have overpromised and under-delivered, says Dr. Brennan Spiegel of the University of Cali- fornia, Los Angeles (Fry & Mukherjee, 2018). ct is a term that has only recently been coined in conjunction with the increased adoption and use of the EHR, EMR, and personal health record (PHR), all of which overlap to some extent in terms of their func- tionality and usage. Their differences gener ally reflect who collects the data, the setting where this occurs, and the comprehensive- ness of the application (Fry & Mukherjee, 2018). In spite of myriad estimates that only as much as 50 percent of the total patient's monitoring as well as process effectiveness. health history, an EHR system comprises the Consider the following example of BUCI broadest description of a patient's medical integration to see how this works suppose a and health history, covering a large collec- patient with cardiovascular disease receives tion of clinical data including ambulatory a stent in a catheterization procedure. Future acute care, and holistic care information. and concurrent caregivers might like to Also, EMRs are used to facilitate clinical know the stent's source, cost. stockkeeping care processes in real time. An EMR is often unit (SKU) identification, and date of manu- employed in a singular ambulatory or acute facture and installation (as well as by whom care setting, such as a freestanding physician's and where) provider follow-up observations: office or hospital, and may or not have any or patient-reported experiences related diagnoses have little electronic connection to another and other therapies provided; patient outcome facility such as an ambulatory or hospital including complications, and other related setting. EMRs lack functionality with regard medical issues. Hypothetically, in the event of to offering a longitudinal view across mul- the patient's continued complaints or a manu- tiple settings of care. The PHR is managed facturer's recall, the organization could search by the patient (or a parent or guardian) and the patient's integrated data and take appropri- ate action and health-related information. The very Ing terminology and need to integrate these dissimilar platforms create a significant dial lenge when attempting to implement sayt les using data from these and other systems Such was a data normalisation will ways be a challenge (FIGURE 11.1). There is correlation between the num ber of mers for intelligence and analytics and the complexities for creating content. The vast number of users generally require more mun dane and more easily created content. More complex content is utilized by smaller audi- ences created by more technical personnel. For example, overdue payment records are easier and more widely distributed than comorbid ties for Parkinsonis disease and depression. CI, when properly implemented will not only support more focused clinical anal- ysis than Bt but should also be designed and managed to integrate "business data for broader analysis, including, for instance, cost accounting data within a clinical analysis. A longitudinal patient medical history com- bined with the business history (eg, charges payments, pharmaceutical prescriptions, or disposable medical equipment consumption) for the same patient would provide invalu- able insights for outcomes measurement and . 11 populated with personally acquired medical Chapter 11 Analytics Business 316 Relationship of Complity for the Content Use and Creation an high oc SOL Complex Dashboard reports, graphe charts, KP low analytics cheduled delivery 80-00 percent pre User base EUR 1.1 Relationship of complexity for content use and creation In spite of tremendous industry and gov- ernmental attention as well as technology advances-healthcare organizations' adoption of comprehensive BI/CI has been disappoint- ingly slow. Some components of reporting. analytics, and data presentation are being used, but usually in siloed application environments. Siloed application environments-such as revenue-cycle or laboratory systems that pull data from separate repositories-tell only part of the story of what is going on for the patient or the organization, rather than providing a more holistic or comprehensive viewpoint. and a host of other considerations are some of the valid reasons for lowering the prioris zation for BI and CI. Nevertheless, surveys of chief information officers (CIO) and other organizational executives by the Healthcare Information and Management Systems Soci ety (HIMSS), the Medical Group Management Association (MGMA), and other member groups consistently indicate that healthcare organizations plan to become proactive in tackling more relevant and dramatic projects within their landscape of data. Such expanded capabilities would be consistent with the bur- geoning development of data warehousing and BI initiatives in other industries. It must be noted that there is a scarcity of data analysts. More work will lead to bet ter industry recruitment for hiring BI and CI talent. Challenging as this work might be. it is both exciting and rewarding. Given the current crises in cost and quality, health care stands to gain as much as, if not more than, These silos can deter progress and syphon off resources that could be devoted toward more integrated BI/CI implementation projects. Cost , limited staff experience, restricted implementation resources, numerous compet- ing mandates and industry requirements (e.g. the mandates for EHR use, and ICD-10 con- versions), data store architectural efficiency, hardware/doud-based performance concerns, Health Como try by increasing its secondary use war Band Cl insights and improve These data analytics platforms will offer ewential capable to be better age and improve the quality of certe by healthcare organito PCASE EXAMPLE: A WELL-DESIGNED BI/CI SOLUTION FOR MULTI-PROVIDER OBGYN CARE lobstetricaynecology Dice had problems wing compact non department and inventorying Gardas The Gardasa vaccine sunted to perman infection which may lead to cervical cancer for maximum effectiveness tened as a series of doses in the same patent. This drug has and the enventory must be destroyed if not used repractice combined data from its purchasing scheduling electronic medical record End oder productivity systems to stratify by provider which patients were recording Gardast. To etter manage the inventory of this vaccine, it then calculated the drug volumes that would be necessary based on trending appointments and the targeted patient population demographic The data provided a list of patients for scheduling and (2) an order process for Gardasil. The resulting nytics provided a quality factor to ensure proper patient scheduling and administration of the drug Incuding a potential recall while saving the practice hundreds of thousands of dollars in wasted inventory. This example demonstrates the many different disciplines involved in improving a single dinical process, along with the resulting impact on cost management and clinical quality (TABLE 11.1). TABLE 11.1 BI/CI for Gardasil at a Northeastern Healthcare Provider All Female Patients, Ages 11-26 Three Shots Given Two Shots Given One Shot Given No Shots Given Cost Revenue Provider 2 26 59.840 29 1 $15,170 582695 18 14 35 $53.640 121 188 Aggarwal 30 517,760 3 2 511520 35 Chang $76,400 $117845 63 32 189 Churchill 304 $49.950 25 $32.400 8 11 80 124 Cooper continued Charter Arne untence and Clinicantegen 10 CASE EXAMPLE: A WELL-DESIGNED BI/CI SOLUTION FOR MULTI-PROVIDER OBGYN CARE Wong Twe AN Female Patients Ages Three Shots Given Shots Given One Shet Given No Shets Given Cest Reve Provider 25 17 121 550,640 150 1 13 55.640 His The heat 46 518360 5230 Gorman 260 270 100 71 5122540 5189 strated Bon of haith = B 20 518.000 523.750 8 data 2 2 3 8 53.840 55920 15 69 22 24 130 555.200 585,100 kat 25 bea 19 8 12 100 140 539,840 561A20 ou 7 1 2 144 134 Paparello $48,480 $75295 26 8 18 Rooman 65 $28,680 544215 Rubinstein 721 325 95 51 233 $107,520 $165,760 Simon 610 218 59 57 268 $117.240 $180,745 Stege 10 1 B $3,120 $4810 Tolland 64 18 11 3 32 $13,560 $20,905 Travassos 714 264 76 79 286 $131,040 5202,020 Tripp 282 139 28 31 82 $40,320 $62,160 319 3 51.080 S165 74 38 28 202 584000 5129.500 1 16 55.280 58,140 2 s 14 24 56.000 59250 1,757 544 486 5,360 2,506 51,084,080 $1671.290 bos Deple by Ric Speaker History of BI and I The healthcare industry has come a long way in data collection and processing. As demon- rated in Chapter 10, there is a massive collec- tion of business and clinical data. Nevertheless, healthcare organizations have a long way to go in effectively organizing and analyzing these data to realize workplace efficiencies and bet- ter medical outcomes. When computers entered the mar- ketplace in the late 1960s and early 1970s, healthcare-related data were generally focused on processing billing and automating the byzantine world of insurance claims. At that time, the landscape for the dominant fee- for-service model for charges, payments, and adjustments was straightforward. Getting paid es providers and paying as payers according o the appropriate procedure and diagnostic odes worked rather well. The financial envi- Onment was characterized by straightfor- mard fee-for-service roimh resource investment--too much for many self-employed physicians and investment risk- adverse hospitals. Pharmaceutical companies just needed to count things they sold, labora- tories sent out results and bills on paper, and payers used massive computers to enroll sub- scribers and adjudicate claims with fewer con- tracting rules than today. Hospitals had paper census lists, paper bills, and paper medical records (and overused photocopy machines). In the early 1980s, an MGMA vendor exhibit hall had fewer than five software ven- dors extolling the virtues of their applications. The majority of vendors had paper products, book publishers, disposable clinical supplies, and the like. Today the same national and regional MGMA meetings are principally software vendors with well over one hundred. As transactional software began to capture data sufficient for providers to file claims and for payers to adjudicate those claims, the art of functional reporting emerged. Reporting hecame an important part of the promise of HIS althcare software. nomont rather