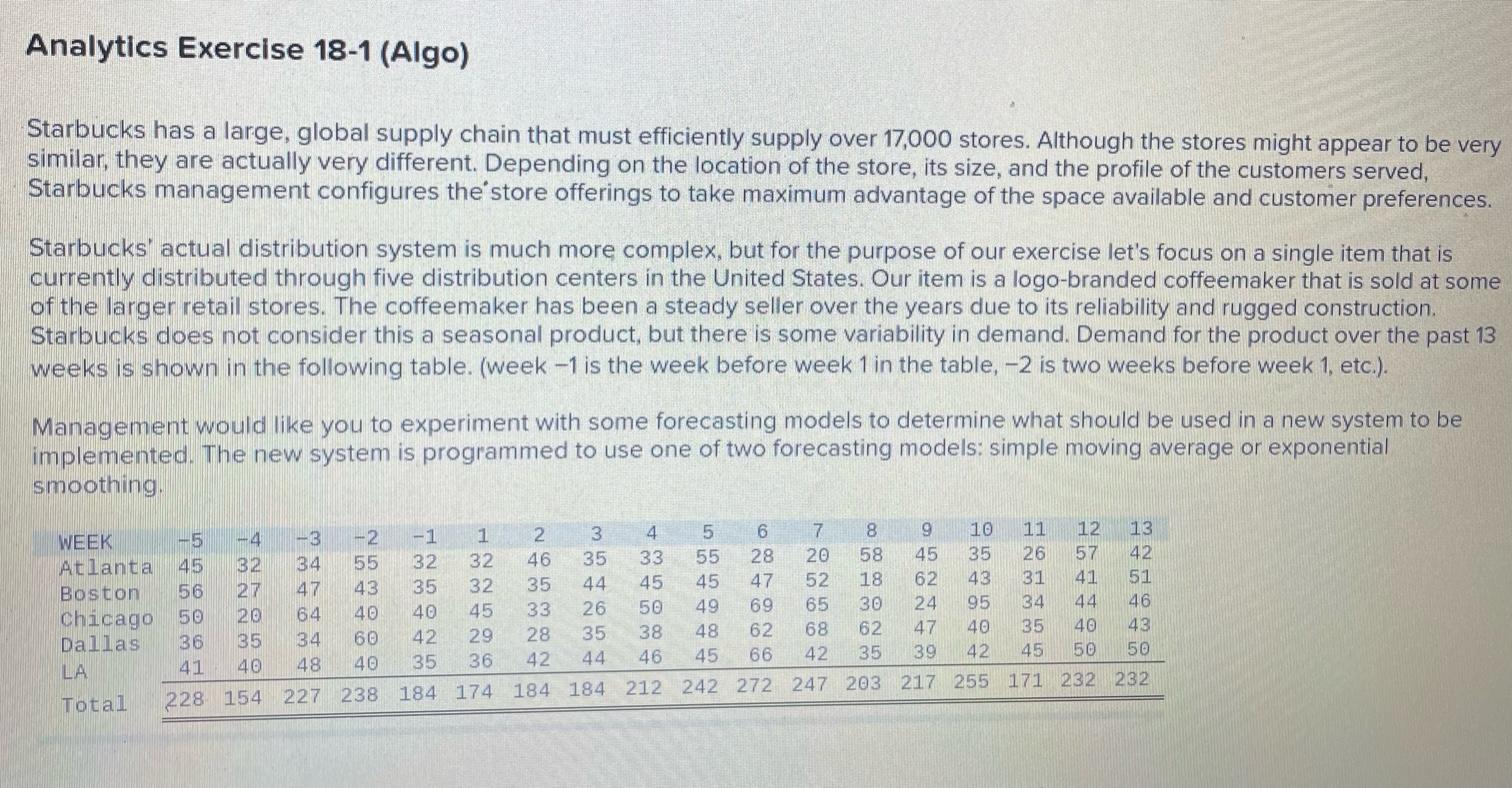
Question: Analytics Exercise 18-1 (Algo) Starbucks has a large, global supply chain that must efficiently supply over 17,000 stores. Although the stores might appear to be

Analytics Exercise 18-1 (Algo) Starbucks has aAnalytics Exercise 18-1 (Algo) Starbucks has aAnalytics Exercise 18-1 (Algo) Starbucks has aAnalytics Exercise 18-1 (Algo) Starbucks has a

Analytics Exercise 18-1 (Algo) Starbucks has a large, global supply chain that must efficiently supply over 17,000 stores. Although the stores might appear to be very similar, they are actually very different. Depending on the location of the store, its size, and the profile of the customers served, Starbucks management configures the store offerings to take maximum advantage of the space available and customer preferences. Starbucks' actual distribution system is much more complex, but for the purpose of our exercise let's focus on a single item that is currently distributed through five distribution centers in the United States. Our item is a logo-branded coffeemaker that is sold at some of the larger retail stores. The coffeemaker has been a steady seller over the years due to its reliability and rugged construction. Starbucks does not consider this a seasonal product, but there is some variability in demand. Demand for the product over the past 13 weeks is shown in the following table. (week -1 is the week before week 1 in the table, -2 is two weeks before week 1, etc.). Management would like you to experiment with some forecasting models to determine what should be used in a new system to be implemented. The new system is programmed to use one of two forecasting models: simple moving average or exponential smoothing. -4 -3 -2 -1 1 WEEK 2 3 5 4 7 8 -5 9 10 11 12 13 55 32 32 46 35 33 6 28 47 20 58 45 35 26 57 42 34 32 45 56 27 47 35 35 32 44 43 45 52 18 43 62 31 41 51 Atlanta Boston Chicago 50 Dallas 40 33 45 26 40 64 69 50 65 30 24 46 95 34 44 62 68 35 20 35 40 47 40 35 40 38 48 28 29 42 62 43 60 34 44 46 45 35 66 42 36 42 35 42 45 39 50 50 LA Total 36 41 40 48 228 154 227 238 184 174 184 184 212 242 272 247 203 217 255 171 232 232 54995 a. Consider using a simple moving average model. Experiment with models using five weeks' and three weeks' past data. (Round yo answers to 2 decimal places.) 3-week MA Week ATL BOS CHI DAL LA Total 1 2 3 4 5 6 7 8 9 10 23 12 13 5-week MA Week 2 3 6 7 8 9 10 ATL BOS CHI DAL LA Total b. Evaluate the forecasts that would have been made over the 13 weeks using the overall (at the end of the 13 weeks) mean absolute deviation, mean absolute percent error, and tracking signal as criteria. (Negative values should be indicated by a minus sign. Round all answers to 2 decimal places. Enter "MAPE" answers as a percentage rounded to 2 decimal places.) ATL BOS CHI DAL LA Avg of DCs 3-week MA MAD MAPE TS 5-week MA MAD MAPE TS

Step by Step Solution

There are 3 Steps involved in it

1 Expert Approved Answer
Step: 1 Unlock blur-text-image
Question Has Been Solved by an Expert!

Get step-by-step solutions from verified subject matter experts

Step: 2 Unlock
Step: 3 Unlock

Students Have Also Explored These Related General Management Questions!