

Question: Analytics in Action Assignment Chapter 4- Ratio Analysis Kieso Intermediate Accounting Download the spreadsheet with select data from most of the DOW 30 companies (excluding
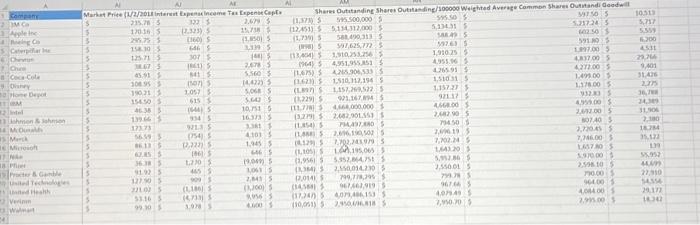
Chapter 4- Ratio Analysis Kieso Intermediate Accounting Download the spreadsheet with select data from most of the DOW 30 companies (excluding some financial and other companies.) (If your instructor did not provide this, you can find this spreadsheet in your WileyPLUS course on the explore tab for chapter 5 under the "Analytics in Action"icon.) 1. Save the spreadsheet you downloaded from your WileyPLUS course or that your instructor provided. On the first tab, you'll see the data needed for this assignment. On the second tab (Ratios-5tudent Submission) the first four columns of data have been copied over for you. Please use columns E-W to submit your answers. 2. Use the select data (tab 1) from most of the DOW 30 companies (excluding some financial and other companies) to calculate liquidity, activity, profitability and coverage ratios. (Reminder, do this on tab 2-Ratios- Student Submission) Use Tab 3 (Graphs and Short Answers) to submit your graphs and answers to the short answer questions below. 3. Create a bar graph that compares asset turnover ratios. - Which types of companies tend to have higher rates of asset turnover? 4. Use column W to divide inventory/total assets. (Ratios-Student Submission) - Add this measure to your bar graph. - What do you notice? Which company doesn't seem to fit with the others? 5. Pick two other ratios to conduct similar analysis as above. Feel free to create new ratios as we did with the inventory/total assets. - What trends do you notice among related industries? Does anything surprise you? Chapter 4- Ratio Analysis Kieso Intermediate Accounting Download the spreadsheet with select data from most of the DOW 30 companies (excluding some financial and other companies.) (If your instructor did not provide this, you can find this spreadsheet in your WileyPLUS course on the explore tab for chapter 5 under the "Analytics in Action"icon.) 1. Save the spreadsheet you downloaded from your WileyPLUS course or that your instructor provided. On the first tab, you'll see the data needed for this assignment. On the second tab (Ratios-5tudent Submission) the first four columns of data have been copied over for you. Please use columns E-W to submit your answers. 2. Use the select data (tab 1) from most of the DOW 30 companies (excluding some financial and other companies) to calculate liquidity, activity, profitability and coverage ratios. (Reminder, do this on tab 2-Ratios- Student Submission) Use Tab 3 (Graphs and Short Answers) to submit your graphs and answers to the short answer questions below. 3. Create a bar graph that compares asset turnover ratios. - Which types of companies tend to have higher rates of asset turnover? 4. Use column W to divide inventory/total assets. (Ratios-Student Submission) - Add this measure to your bar graph. - What do you notice? Which company doesn't seem to fit with the others? 5. Pick two other ratios to conduct similar analysis as above. Feel free to create new ratios as we did with the inventory/total assets. - What trends do you notice among related industries? Does anything surprise you
Step by Step Solution
There are 3 Steps involved in it

Get step-by-step solutions from verified subject matter experts