

Question: Analytics mindset Implementing the DuPont Method Part : Apply appropriate data analytic techniques You are now ready to analyze the data. Previously, you Identified five
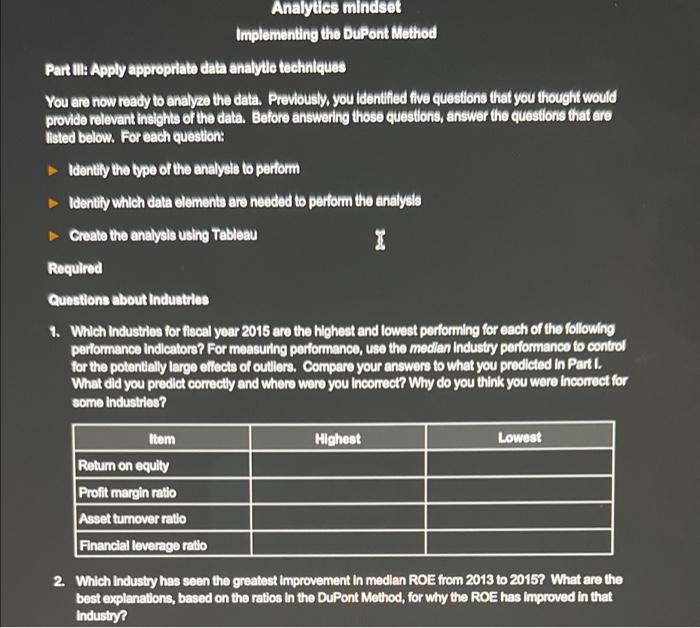
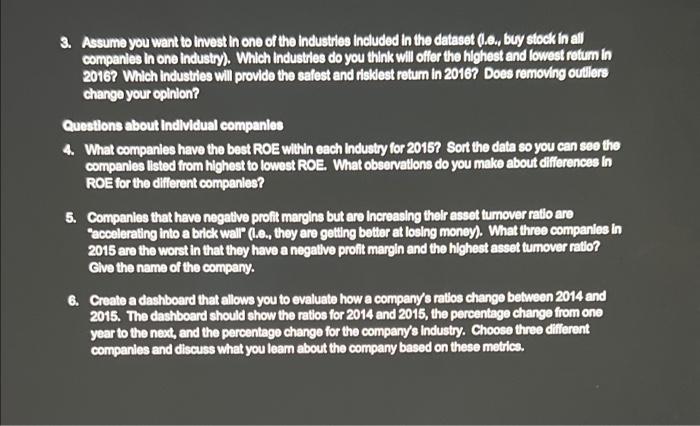
Analytics mindset Implementing the DuPont Method Part : Apply appropriate data analytic techniques You are now ready to analyze the data. Previously, you Identified five questions that you thought would provide relevant insights of the data. Before answering those questions, answer the questions that are listed below. For each question: Identify the type of the analysis to perform Identity which data elements are needed to perform the analysis Create the analysis using Tableau 1 Required Questions about Industries 1. Which Industries for fiscal year 2015 are the highest and lowest performing for each of the following performance Indicators ? For measuring performance, use the median Industry performance to control for the potentially large effects of outlers. Compare your answers to what you predicted in Part I. What did you predict correctly and where were you incorrect? Why do you think you were Incorrect for some Industries? Item Highest Lowest Return on equity Profit margin ratio Asset turnover ratio Financial leverage ratio 2. Which Industry has seen the greatest Improvement In median ROE from 2013 to 2015? What are the best explanations, based on the ratios in the DuPont Method, for why the ROE has improved in that industry? 3. Assume you want to invest in one of the Industries Included in the dataset (1.e., buy stock in all companies in one industry). Which Industries do you think will offer the highest and lowest return in 2016? Which Industries will provide the safest and risklest return in 2016? Does removing outlers change your opinion? Questions about Individual companles 4. What companies have the best ROE within each Industry for 2015? Sort the data so you can see the companles listed from highest to lowest ROE. What observations do you make about differences in ROE for the different companies? 5. Companies that have negative profit margins but are increasing thelr asset tumover ratio are "accelerating into a brick wall" (1.6., they are getting better at losing money). What three companies in 2015 are the worst in that they have a negative profit margin and the highest asset tumover ratio? Glve the name of the company. 6. Create a dashboard that allows you to evaluate how a company's ratios change between 2014 and 2015. The dashboard should show the ratios for 2014 and 2015, the percentage change from one year to the next, and the percentage change for the company's Industry. Choose three different companies and discuss what you learn about the company based on these metrics. Analytics mindset Implementing the DuPont Method Part : Apply appropriate data analytic techniques You are now ready to analyze the data. Previously, you Identified five questions that you thought would provide relevant insights of the data. Before answering those questions, answer the questions that are listed below. For each question: Identify the type of the analysis to perform Identity which data elements are needed to perform the analysis Create the analysis using Tableau 1 Required Questions about Industries 1. Which Industries for fiscal year 2015 are the highest and lowest performing for each of the following performance Indicators ? For measuring performance, use the median Industry performance to control for the potentially large effects of outlers. Compare your answers to what you predicted in Part I. What did you predict correctly and where were you incorrect? Why do you think you were Incorrect for some Industries? Item Highest Lowest Return on equity Profit margin ratio Asset turnover ratio Financial leverage ratio 2. Which Industry has seen the greatest Improvement In median ROE from 2013 to 2015? What are the best explanations, based on the ratios in the DuPont Method, for why the ROE has improved in that industry? 3. Assume you want to invest in one of the Industries Included in the dataset (1.e., buy stock in all companies in one industry). Which Industries do you think will offer the highest and lowest return in 2016? Which Industries will provide the safest and risklest return in 2016? Does removing outlers change your opinion? Questions about Individual companles 4. What companies have the best ROE within each Industry for 2015? Sort the data so you can see the companles listed from highest to lowest ROE. What observations do you make about differences in ROE for the different companies? 5. Companies that have negative profit margins but are increasing thelr asset tumover ratio are "accelerating into a brick wall" (1.6., they are getting better at losing money). What three companies in 2015 are the worst in that they have a negative profit margin and the highest asset tumover ratio? Glve the name of the company. 6. Create a dashboard that allows you to evaluate how a company's ratios change between 2014 and 2015. The dashboard should show the ratios for 2014 and 2015, the percentage change from one year to the next, and the percentage change for the company's Industry. Choose three different companies and discuss what you learn about the company based on these metrics
Step by Step Solution
There are 3 Steps involved in it

Get step-by-step solutions from verified subject matter experts