

Question: Analytics mindset Part III ( 6 0 points ) : Now that the data is loaded into the tool you will use to analyze the
Analytics mindset Part III points:
Now that the data is loaded into the tool you will use to analyze the results, you should answer the questions you developed. In addition to
answering those questions, Noah has developed a specific set of questions for you to answer.
Required
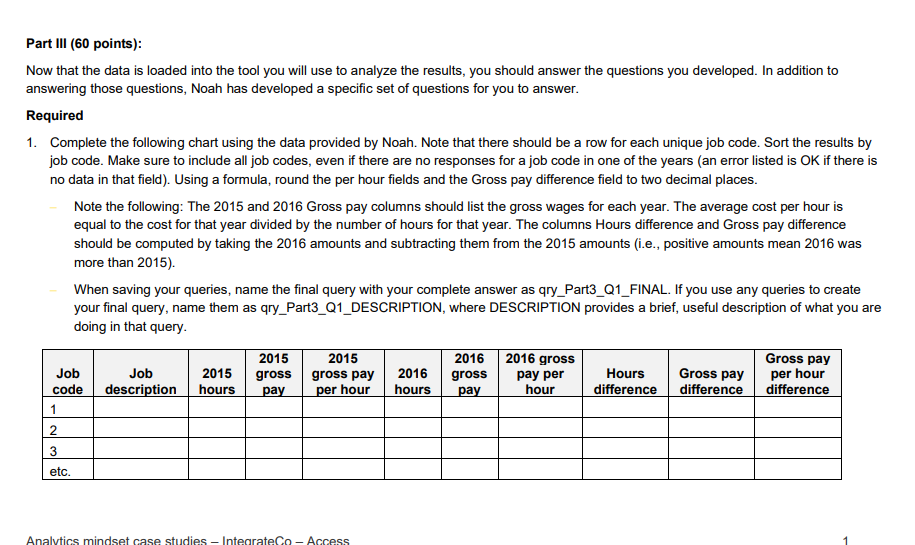
Complete the following chart using the data provided by Noah. Note that there should be a row for each unique job code. Sort the results by
job code. Make sure to include all job codes, even if there are no responses for a job code in one of the years an error listed is OK if there is
no data in that field Using a formula, round the per hour fields and the Gross pay difference field to two decimal places.
Note the following: The and Gross pay columns should list the gross wages for each year. The average cost per hour is
equal to the cost for that year divided by the number of hours for that year. The columns Hours difference and Gross pay difference
should be computed by taking the amounts and subtracting them from the amounts ie positive amounts mean was
more than
When saving your queries, name the final query with your complete answer as qryPartQFINAL. If you use any queries to create
your final query, name them as qryPartQDESCRIPTION, where DESCRIPTION provides a brief, useful description of what you are
doing in that query. Write a query to return the information listed in the chart below. Design the query so that the user is prompted to enter the job code and the results are only returned for that job code. Only return results for employees who have more than zero hours and zero wages in a job code for both and Sort the query in ascending order by the Gross pay difference. Using a formula, round the per hour, Hours difference and Gross pay difference fields to two decimal places. Investigate the three job codes with the largest positive wage differences found in the previous query that had wages and hours for both and
tableJob code,tableEmployeenumbertableEmployeenametablehourstablegrosspaytablegrosspay perhourtablehourstablegrosspaytablegross payper hourtableHoursdifferencetableGrosspaydifferencetableGross payper hourdifferenceetc
Prepare a
IntegrateCo
Part III points:
Now that the data is loaded into the tool you will use to analyze the results, you should answer the questions you developed. In addition to
answering those questions, Noah has developed a specific set of questions for you to answer.
Required
Complete the following chart using the data provided by Noah. Note that there should be a row for each unique job code. Sort the results by
job code. Make sure to include all job codes, even if there are no responses for a job code in one of the years an error listed is OK if there is
no data in that field Using a formula, round the per hour fields and the Gross pay difference field to two decimal places.
Note the following: The and Gross pay columns should list the gross wages for each year. The average cost per hour is
equal to the cost for that year divided by the number of hours for that year. The columns Hours difference and Gross pay difference
should be computed by taking the amounts and subtracting them from the amounts ie positive amounts mean was
more than
When saving your queries, name the final query with your complete answer as qryPartQFINAL. If you use any queries to create
your final query, name them as qryPartQDESCRIPTION, where DESCRIPTION provides a brief, useful description of what you are
doing in that query.
Job code Job description hours gross pay gross pay per hour hours gross pay gross pay per hour Hours difference Gross pay difference Gross pay per hour difference
Write a query to return the information listed in the chart below. Design the query so that the user is prompted to enter the job code and the results are only returned for that job code. Only return results for employees who have more than zero hours and zero wages in a job code for both and Sort the query in ascending order by the Gross pay difference. Using a formula, round the per hour, Hours difference and Gross pay difference fields to two decimal places. Investigate the three job codes with the largest positive wage differences found in the previous query that had wages and hours for both and
Prepare a written report and a presentation to Noah about what you have learned. Make sure to include the tables above and any additional tables that you created. Discuss any discrepancies that you observed and make suggestions about what you recommend Noah should do next. Your group will present your findings in class.
Step by Step Solution
There are 3 Steps involved in it
1 Expert Approved Answer
Step: 1 Unlock

Question Has Been Solved by an Expert!
Get step-by-step solutions from verified subject matter experts
Step: 2 Unlock
Step: 3 Unlock