

Question: ANALYZE AND EVALUATE COMPANY PERFOMANCE EXPLAINS: (a) TIME SERIES ANALYSIS FOR EACH RATIO : (b) CROSS SECTIONAL ANALYSIS FOR EACH RATIO WITH PLOTTING GRAPH? 1)
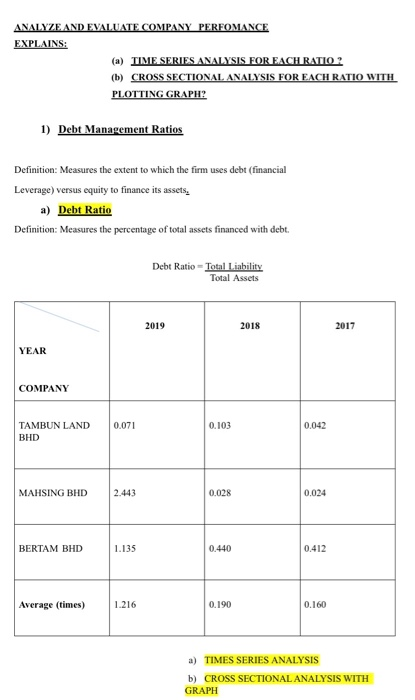
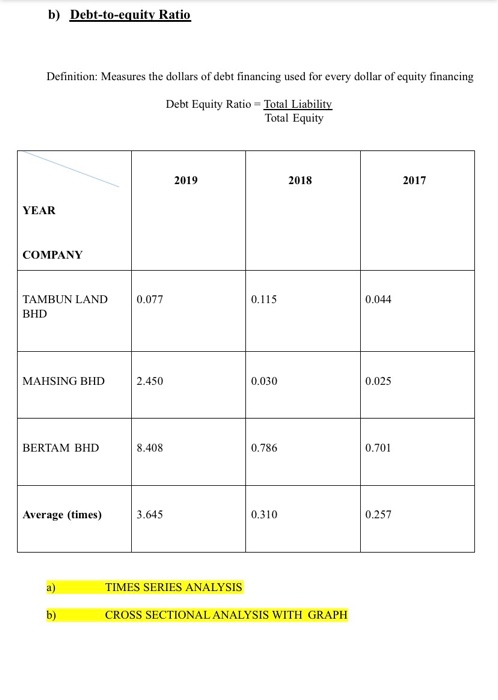
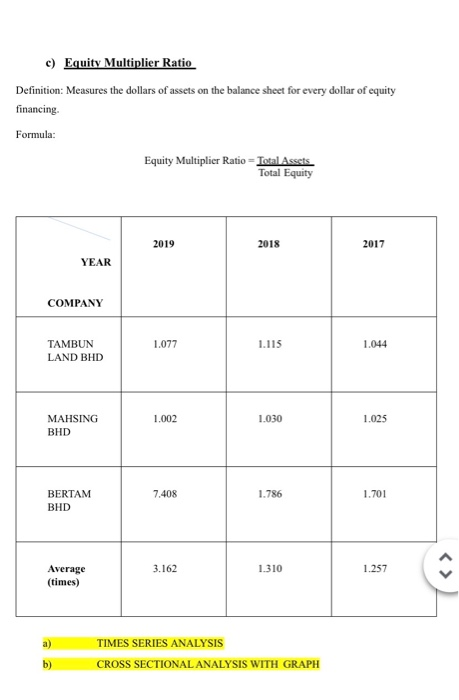
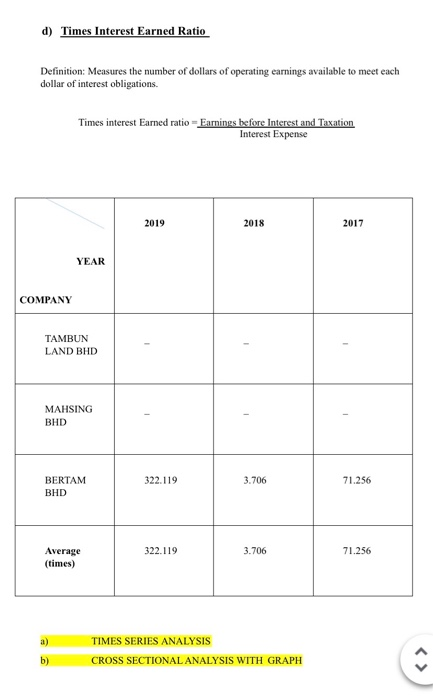
ANALYZE AND EVALUATE COMPANY PERFOMANCE EXPLAINS: (a) TIME SERIES ANALYSIS FOR EACH RATIO : (b) CROSS SECTIONAL ANALYSIS FOR EACH RATIO WITH PLOTTING GRAPH? 1) Debt Management Ratios Definition: Measures the extent to which the firm uses debt (financial Leverage) versus equity to finance its assets. a) Debt Ratio Definition: Measures the percentage of total assets financed with debt. Debt Ratio - Total Liability Total Assets 2019 2018 2017 YEAR COMPANY 0.071 0.103 0.042 TAMBUN LAND BHD MAHSING BHD 2.443 0.028 0.024 BERTAM BHD 1.135 0.440 0.412 Average (times) 1.216 0.190 0.160 a) TIMES SERIES ANALYSIS b) CROSS SECTIONAL ANALYSIS WITH GRAPH b) Debt-to-equity Ratio Definition: Measures the dollars of debt financing used for every dollar of equity financing Debt Equity Ratio - Total Liability Total Equity 2019 2018 2017 YEAR COMPANY 0.077 0.115 0.044 TAMBUN LAND BHD MAHSING BHD 2.450 0.030 0.025 BERTAM BHD 8.408 0.786 0.701 Average (times) 3.645 0.310 0.257 TIMES SERIES ANALYSIS CROSS SECTIONAL ANALYSIS WITH GRAPH b) c) Equity Multiplier Ratio Definition: Measures the dollars of assets on the balance sheet for every dollar of equity financing Formula: Equity Multiplier Ratio - Total Assets Total Equity 2019 2018 2017 YEAR COMPANY 1.077 1.115 1.044 TAMBUN LAND BHD 1.002 1.030 1.025 MAHSING BHD 7.408 1.786 1.701 BERTAM BHD 3.162 1.310 1.257 Average (times) a) TIMES SERIES ANALYSIS CROSS SECTIONAL ANALYSIS WITH GRAPH b) d) Times Interest Earned Ratio Definition: Measures the number of dollars of operating earnings available to meet each dollar of interest obligations Times interest Earned ratio - Earnings before Interest and Taxation Interest Expense 2019 2018 2017 YEAR COMPANY TAMBUN LAND BHD MAHSING BHD 322.119 3.706 BERTAM BHD 71.256 322.119 3.706 71.256 Average (times) TIMES SERIES ANALYSIS CROSS SECTIONAL ANALYSIS WITH GRAPH b) ANALYZE AND EVALUATE COMPANY PERFOMANCE EXPLAINS: (a) TIME SERIES ANALYSIS FOR EACH RATIO : (b) CROSS SECTIONAL ANALYSIS FOR EACH RATIO WITH PLOTTING GRAPH? 1) Debt Management Ratios Definition: Measures the extent to which the firm uses debt (financial Leverage) versus equity to finance its assets. a) Debt Ratio Definition: Measures the percentage of total assets financed with debt. Debt Ratio - Total Liability Total Assets 2019 2018 2017 YEAR COMPANY 0.071 0.103 0.042 TAMBUN LAND BHD MAHSING BHD 2.443 0.028 0.024 BERTAM BHD 1.135 0.440 0.412 Average (times) 1.216 0.190 0.160 a) TIMES SERIES ANALYSIS b) CROSS SECTIONAL ANALYSIS WITH GRAPH b) Debt-to-equity Ratio Definition: Measures the dollars of debt financing used for every dollar of equity financing Debt Equity Ratio - Total Liability Total Equity 2019 2018 2017 YEAR COMPANY 0.077 0.115 0.044 TAMBUN LAND BHD MAHSING BHD 2.450 0.030 0.025 BERTAM BHD 8.408 0.786 0.701 Average (times) 3.645 0.310 0.257 TIMES SERIES ANALYSIS CROSS SECTIONAL ANALYSIS WITH GRAPH b) c) Equity Multiplier Ratio Definition: Measures the dollars of assets on the balance sheet for every dollar of equity financing Formula: Equity Multiplier Ratio - Total Assets Total Equity 2019 2018 2017 YEAR COMPANY 1.077 1.115 1.044 TAMBUN LAND BHD 1.002 1.030 1.025 MAHSING BHD 7.408 1.786 1.701 BERTAM BHD 3.162 1.310 1.257 Average (times) a) TIMES SERIES ANALYSIS CROSS SECTIONAL ANALYSIS WITH GRAPH b) d) Times Interest Earned Ratio Definition: Measures the number of dollars of operating earnings available to meet each dollar of interest obligations Times interest Earned ratio - Earnings before Interest and Taxation Interest Expense 2019 2018 2017 YEAR COMPANY TAMBUN LAND BHD MAHSING BHD 322.119 3.706 BERTAM BHD 71.256 322.119 3.706 71.256 Average (times) TIMES SERIES ANALYSIS CROSS SECTIONAL ANALYSIS WITH GRAPH b)
Step by Step Solution
There are 3 Steps involved in it

Get step-by-step solutions from verified subject matter experts