

Question: ANALYZE AND EVALUATE COMPANY PERFORMANCE PLEASE SHOW STEP BY STEP. CALCULATE THE FOLLOWING 15 QUESTION BASED ON THE STATEMENT 1)Quick ratio 2)Cash ratio 3)Current ratio
ANALYZE AND EVALUATE COMPANY PERFORMANCE
PLEASE SHOW STEP BY STEP. CALCULATE THE FOLLOWING 15 QUESTION BASED ON THE STATEMENT
1)Quick ratio
2)Cash ratio
3)Current ratio
4)Days Sales outstanding
5)Average payment period
6)Debt ratio
7)Debt equity ratio
8)Equity multiplier
9)Profitability Ratios
10)Profit Margin
11)Return on Asset
12)Return on Equity
13)Market to Book ratios
14)Price to Earning ratio
15)DuPont Analysis
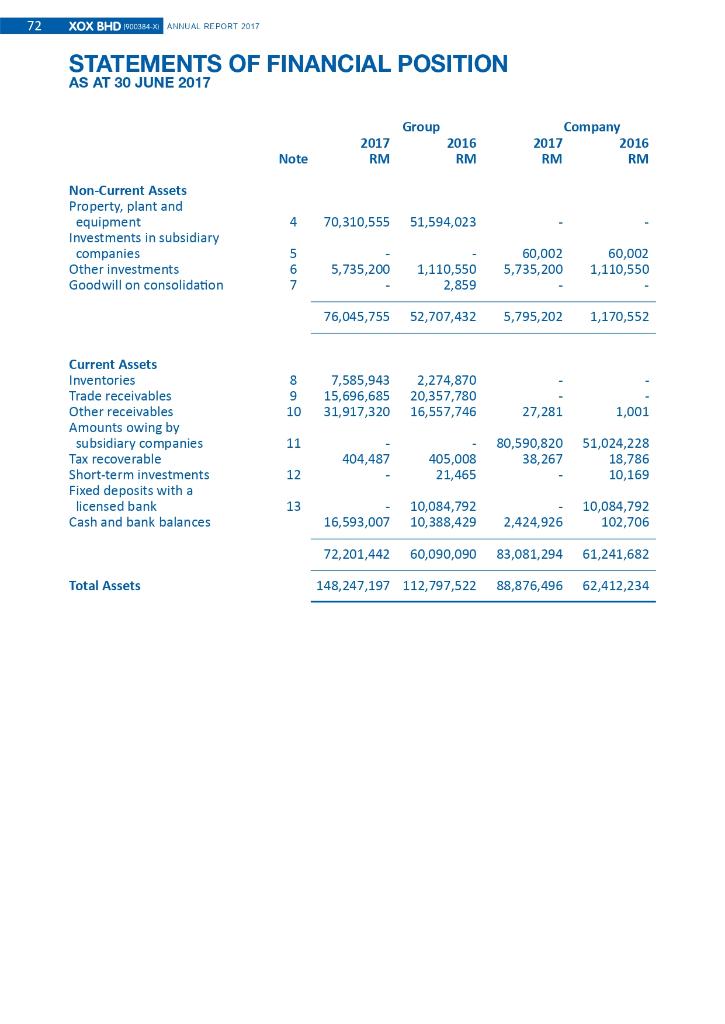
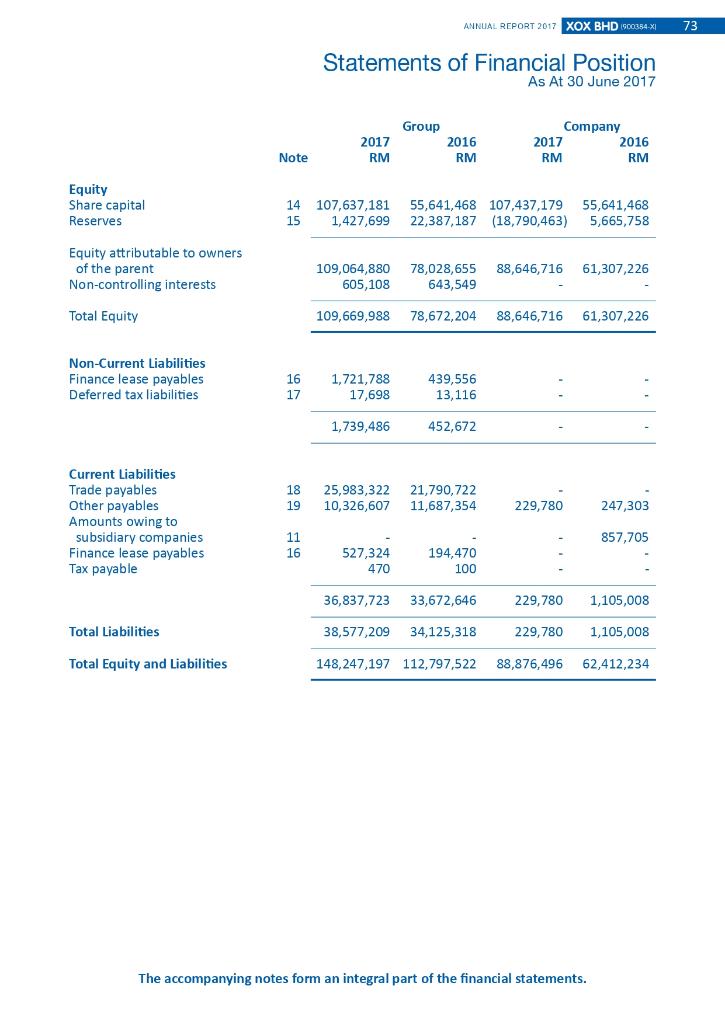
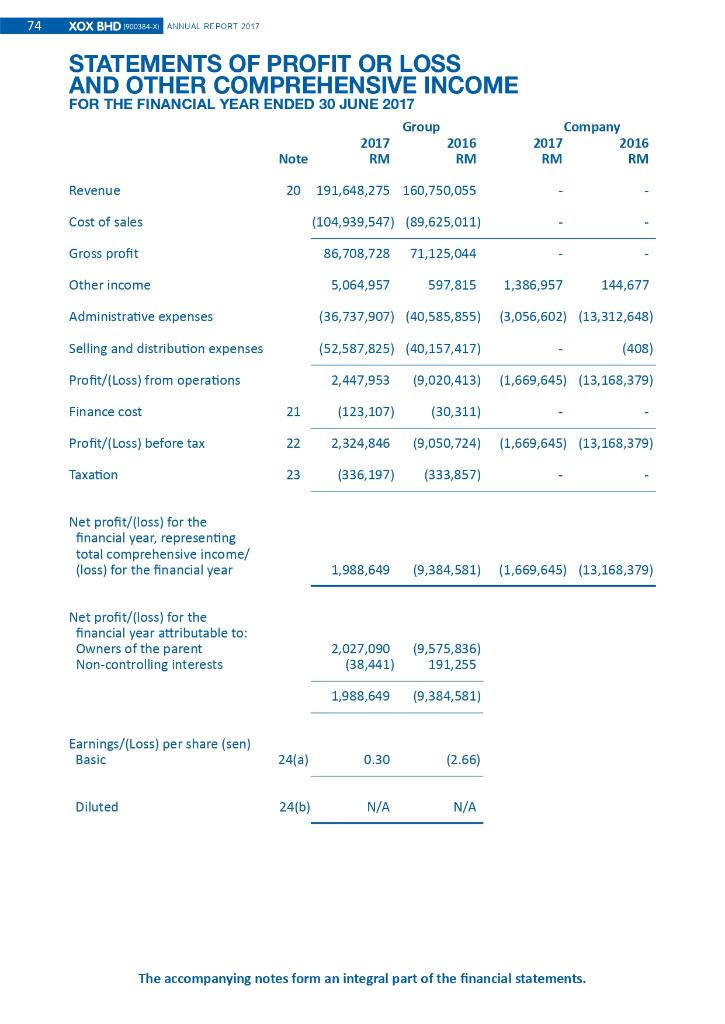
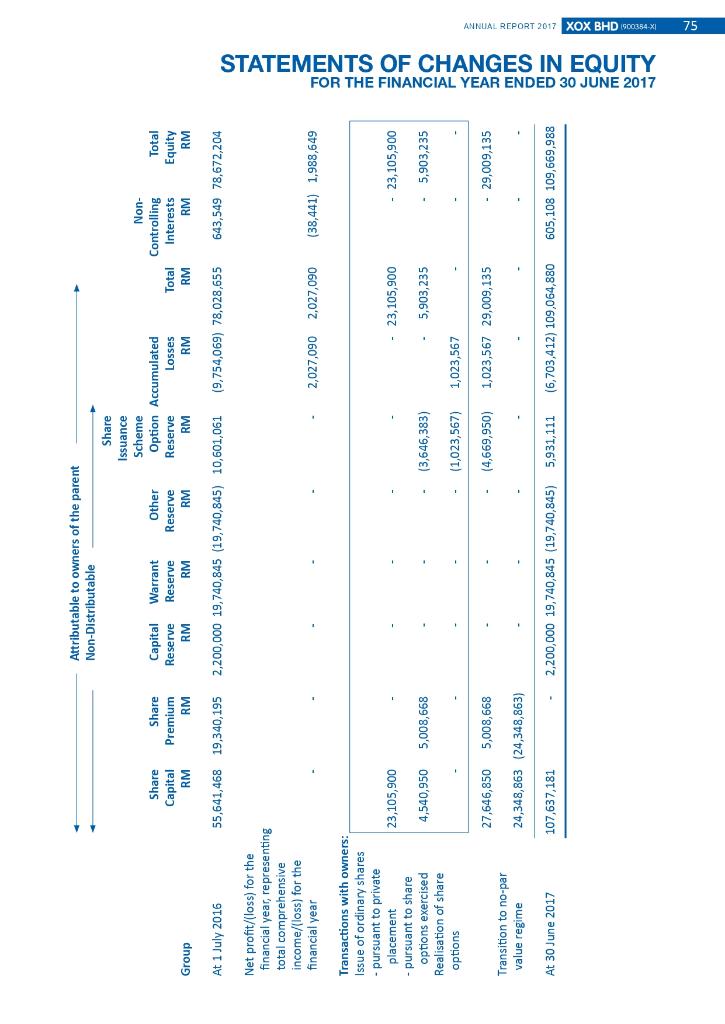
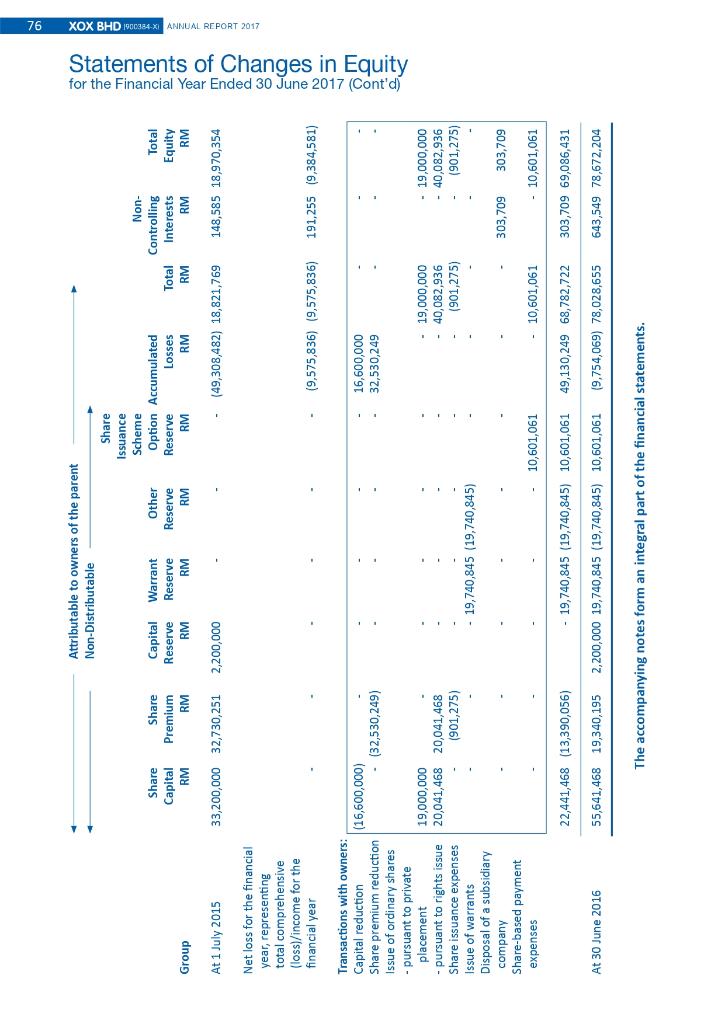
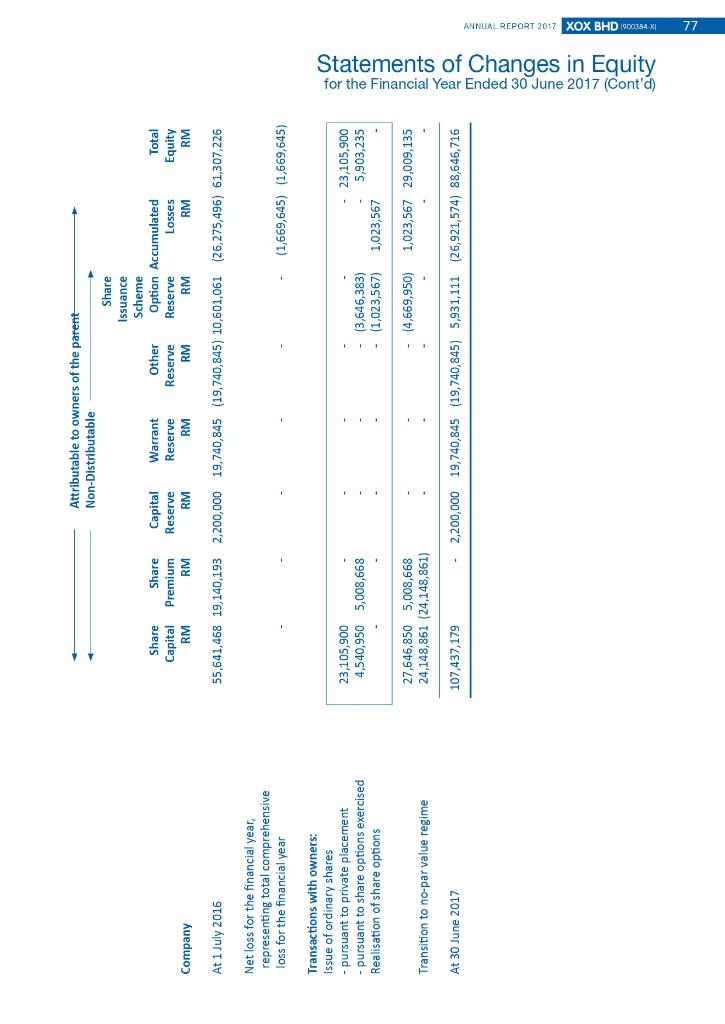
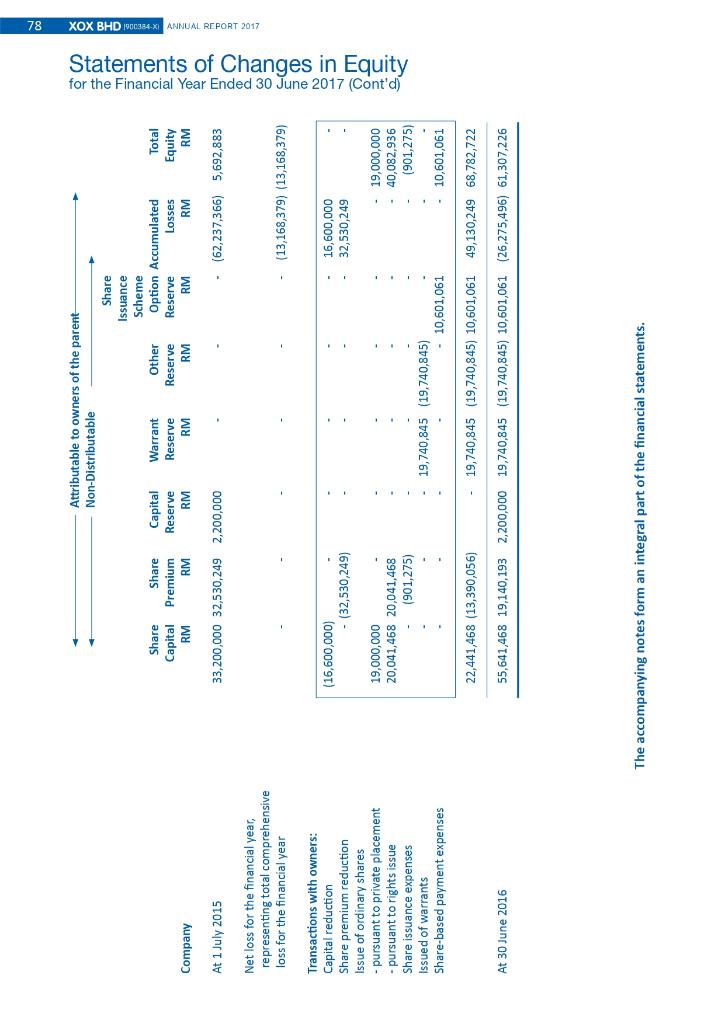
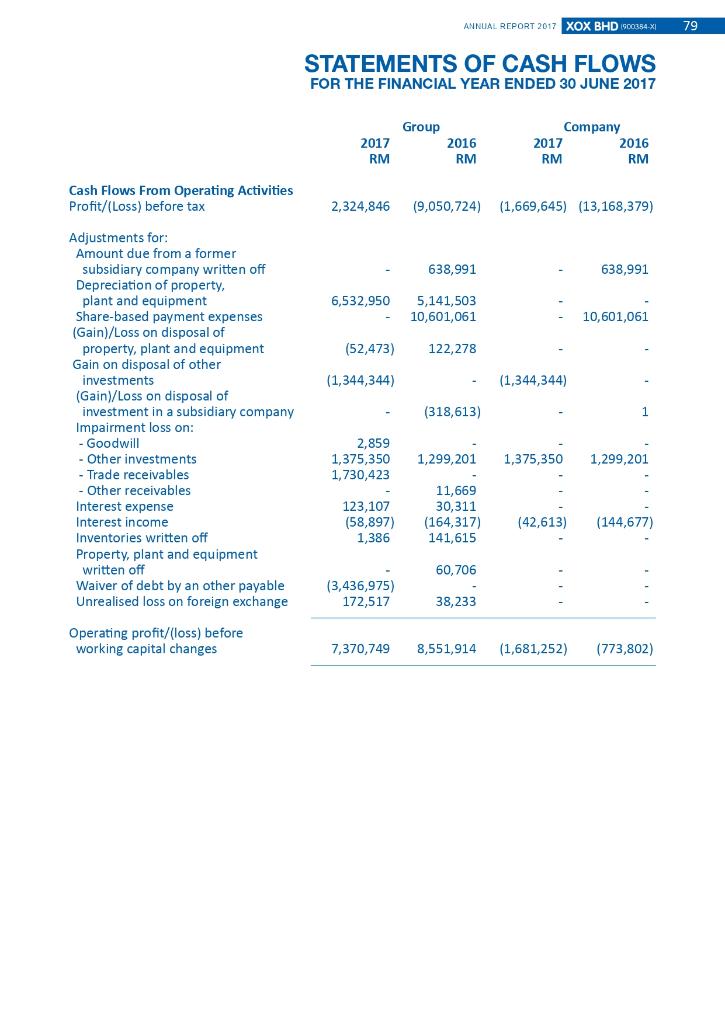
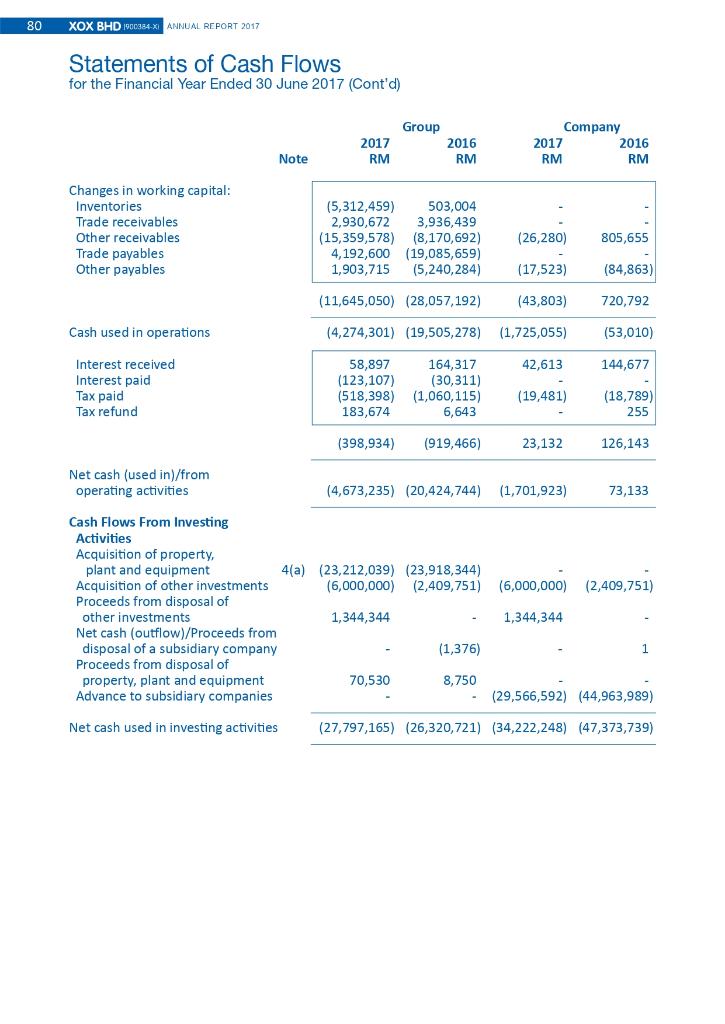
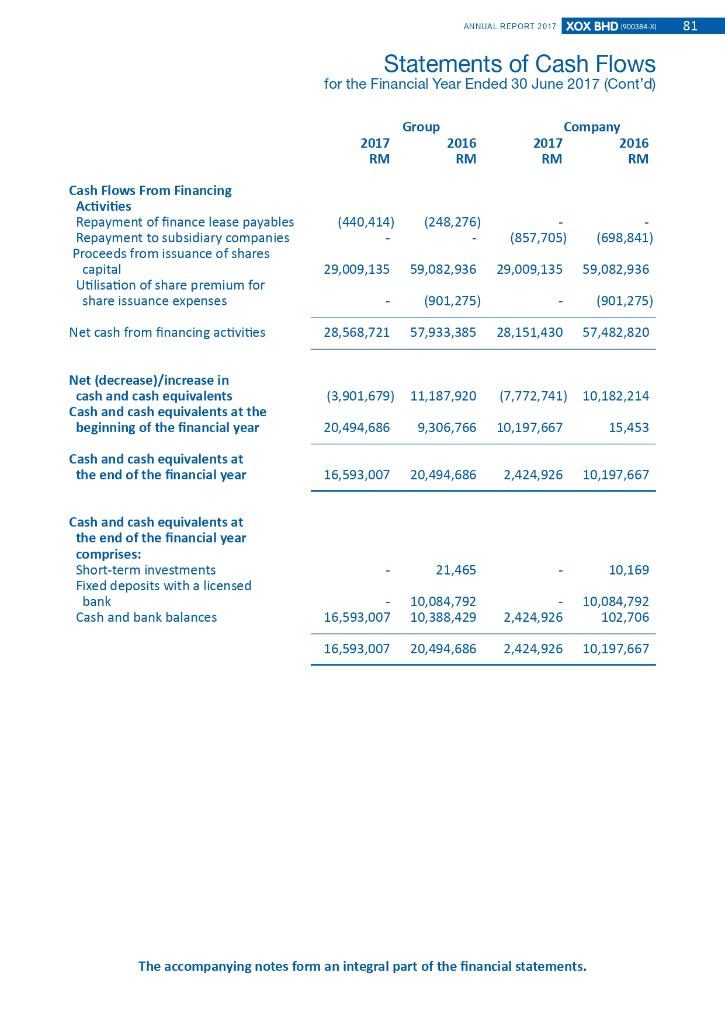
72 XOX BHD 1000384 XI ANNUAL REPORT 2017 STATEMENTS OF FINANCIAL POSITION AS AT 30 JUNE 2017 2017 RM Group 2016 RM Company 2017 2016 RM RM Note Non-Current Assets Property, plant and equipment Investments in subsidiary 4 70,310,555 51,594,023 companies 5 6 5,735,200 60,002 5,735,200 1,110,550 2,859 60,002 1,110,550 Other investments Goodwill on consolidation 76,045,755 52,707,432 5,795,202 1,170,552 8 9 10 7,585,943 15,696,685 31,917,320 2,274,870 20,357,780 16,557,746 27,281 1,001 Current Assets Inventories Trade receivables Other receivables Amounts owing by subsidiary companies Tax recoverable Short-term investments Fixed deposits with a licensed bank Cash and bank balances 11 80,590,820 38,267 404,487 405,008 21,465 51,024,228 18,786 10,169 12 13 10,084,792 10,084,792 10,388,429 16,593,007 2,424,926 102,706 72,201,442 60,090,090 83,081,294 61,241,682 Total Assets 148, 247,197 112,797,522 88,876,496 62,412,234 ANNUAL REPORT 2017 XOX BHD SC0334-XI 73 Statements of Financial Position As At 30 June 2017 2017 RM Group 2016 RM Company 2017 2016 RM RM Note Equity Share capital Reserves 14 15 107,637,181 1,427,699 55,641,468 107,437,179 22,387,187 (18,790,463) 55,641,468 5,665,758 Equity attributable to owners of the parent Non-controlling interests 88,646,716 61,307,226 109,064,880 605,108 78,028,655 643,549 Total Equity 109,669,988 78,672,204 88,646,716 61,307,226 Non-Current Liabilities Finance lease payables Deferred tax liabilities 16 17 1,721,788 17,698 439,556 13,116 1,739,486 452,672 18 19 25,983,322 10,326,607 21,790,722 11,687,354 229,780 247,303 Current Liabilities Trade payables Other payables Amounts owing to subsidiary companies Finance lease payables Tax payable 857,705 11 16 527,324 470 194,470 100 36,837,723 33,672,646 229,780 1,105,008 Total Liabilities 38,577,209 34,125,318 229,780 1,105,008 Total Equity and Liabilities 148, 247,197 112,797,522 88,876,496 62,412,234 The accompanying notes form an integral part of the financial statements. 74 XOX BHD 1000364-XI ANNUAL REPORT 2017 STATEMENTS OF PROFIT OR LOSS AND OTHER COMPREHENSIVE INCOME FOR THE FINANCIAL YEAR ENDED 30 JUNE 2017 Group 2017 RM 2016 RM Company 2017 2016 RM RM Note Revenue 20 191,648,275 160,750,055 Cost of sales (104,939,547) (89,625,011) Gross profit 86,708,728 71,125,044 Other income 5,064,957 597,815 1,386,957 144,677 Administrative expenses (36,737,907) (40,585,855) (3,056,602) (13,312,648) Selling and distribution expenses (52,587,825) (40,157,417) (408) Profit/(Loss) from operations 2,447,953 (9,020,413) (1,669,645) (13,168,379) Finance cost 21 (123,107) (30,311) Profit/(Loss) before tax 22 2,324,846 (9,050,724) (1,669,645) (13,168,379) Taxation 23 (336,197) (333,857) Net profit/(loss) for the financial year, representing total comprehensive income/ (loss) for the financial year 1,988,649 (9,384,581) (1,669,645) (13,168,379) Net profit/(loss) for the financial year attributable to: Owners of the parent Non-controlling interests 2,027,090 (38,441) (9,575,836) 191,255 1,988,649 (9,384,581) Earnings/(Loss) per share (sen) Basic 24/a) 0.30 (2.66) Diluted 24(b) N/A N/A The accompanying notes form an integral part of the financial statements. Attributable to owners of the parent Non-Distributable Share Issuance Scheme Capital Warrant Other Option Accumulated Reserve Reserve Reserve Reserve Losses RM RM RM RM RM Share Share Capital RM Non- Controlling Interests RM Premium Total RM Total Equity RM Group RM At 1 July 2016 55,641,468 19,340,195 2,200,000 19,740,845 (19,740,845) 10,601,061 (9,754,069) 78,028,655 643,549 78,672,204 Net profit/(loss) for the financial year, representing total comprehensive income/loss) for the financial year 2,027,090 2,027,090 (38,441) 1,988,649 - 23,105,900 Transactions with owners: Issue of ordinary shares - pursuant to private placement 23,105,900 to share options exercised 4,540,950 Realisation of share options - 23,105,900 -pursuant 5,008,668 (3,646,383) 5,903,235 - 5,903,235 (1,023,567) 1,023,567 27,646,850 5,008,668 (4,669,950) 1,023,567 29,009, 135 - 29,009,135 Transition to no-par value regime THE FINANCIAL YEAR ENDED 30 JUNE 2017 24,348,863 (24,348,863) At 30 June 2017 107,637,181 2,200,000 19,740,845 (19,740,845) 5,931,111 (6,703,412) 109,064,880 605,108 109,669,988 ANNUAL REPORT 2017 XOX BHD 500354.81 75 Attributable to owners of the parent Non-Distributable Share Issuance Scheme Capital Warrant Other Option Accumulated Reserve Reserve Reserve Reserve Losses RM RM RM RM RM XOX BHD 900 Share Capital RM Share Premium RM Non- Controlling Interests RM Total RM Total Equity RM Group At 1 July 2015 33,200,000 32,730,251 2,200,000 (49,308,482) 18,821,769 148,585 18,970,354 ANNUAL REPORT 2017 for the Financial Year Ended 30 June 2017 (Cont'd) Statements of Changes in Equity Net loss for the financial year, representing total comprehensive (loss)/income for the financial year (9,575,836) (9,575,836) 191,255 (9,384,581) (16,600,000) . (32,530,249) 16,600,000 32,530,249 Transactions with owners: Capital reduction Share premium reduction Issue of ordinary shares - pursuant to private placement - pursuant to rights issue Share issuance expenses Issue of warrants Disposal of a subsidiary company Share-based payment expenses 19,000,000 20,041,468 20,041,468 (901,275) 19,000,000 40,082,936 (901,275) - 19,000,000 40,082,936 (901,275) 19,740,845 (19,740,845) 303,709 303,709 10,601,061 10,601,061 - 10,601,061 22,441,468 (13,390,056) - 19,740,845 (19,740,845) 10,601,061 49,130,249 68,782,722 303,709 69,086,431 At 30 June 2016 55,641,468 19,340,195 2,200,000 19,740,845 (19,740,845) 10,601,061 (9,754,069) 78,028,655 643,549 78,672,204 The accompanying notes form an integral part of the financial statements. Attributable to owners of the parent Non-Distributable Share Issuance Scheme Capital Warrant Other Option Accumulated Reserve Reserve Reserve Reserve Losses RM RM RM RM RM Share Capital RM Share Premium RM Total Equity RM Company At 1 July 2016 55,641,468 19,140,193 2,200,000 19,740,845 (19,740,845) 10,601,061 (26,275,496) 61,307,226 Net loss for the financial year, representing total comprehensive loss for the financial year (1,669,645) (1,669,645) Transactions with owners: Issue of ordinary shares - pursuant to private placement - pursuant to share options exercised Realisation of share options 23,105,900 4,540,950 5,008,668 (3,646,383) (1,023,567) 23,105,900 5,903,235 1,023,567 (4,669,950) 1,023,567 29,009,135 27,646,850 5,008,668 24,148,861 (24,148,861) Transition to no-par value regime At 30 June 2017 107,437,179 2,200,000 19,740,845 (19,740,845) 5,931,111 (26,921,574) 88,646,716 for the Financial Year Ended 30 June 2017 (Cont'd) Statements of Changes in Equity ANNUAL REPORT 2017 XOX BHD 00354.44 77 Attributable to owners of the parent Non-Distributable Share Issuance Scheme Capital Warrant Other Option Accumulated Reserve Reserve Reserve Reserve Losses RM RM RM RM RM XOX BHD 1900 Share Share Capital Premium RM RM Total Equity RM Company At 1 July 2015 33,200,000 32,530,249 2,200,000 (62,237,366) 5,692,883 for the Financial Year Ended 30 June 2017 (Cont'd) Statements of Changes in Equity ANNUAL REPORT 2017 Net loss for the financial year, representing total comprehensive loss for the financial year (13,168,379) (13,168,379) Share (16,600,000) - (32,530,249) 16,600,000 32,530,249 Transactions with owners: Capital reduction premium reduction Issue of ordinary shares - pursuant to private placement - pursuant to rights issue Share issuance expenses Issued of warrants Share-based payment expenses 19,000,000 20,041,468 20,041,468 (901,275) 19,000,000 40,082,936 (901,275) 19,740,845 (19,740,845) - 10,601,061 10,601,061 22,441,468 (13,390,056) 19,740,845 (19,740,845) 10,601,061 49,130,249 68,782,722 At 30 June 2016 55,641,468 19,140,193 2,200,000 19,740,845 (19,740,845) 10,601,061 (26,275,496) 61,307,226 The accompanying notes form an integral part of the financial statements. ANNUAL REPORT 2017 XOX BHD 900384-XI 79 STATEMENTS OF CASH FLOWS FOR THE FINANCIAL YEAR ENDED 30 JUNE 2017 2017 RM Group 2016 RM Company 2017 2016 RM RM Cash Flows From Operating Activities Profit/(Loss) before tax 2,324,846 (9,050,724) (1,669,645) (13,168,379) 638,991 638,991 6,532,950 5,141,503 10,601,061 10,601,061 (52,473) 122,278 (1,344,344) (1,344,344) (318,613) Adjustments for: Amount due from a former subsidiary company written off Depreciation of property, plant and equipment Share-based payment expenses (Gain)/Loss on disposal of property, plant and equipment Gain on disposal of other investments (Gain)/Loss on disposal of investment in a subsidiary company Impairment loss on: Goodwill - Other investments Trade receivables Other receivables Interest expense Interest income mento Inventories written off Property, plant and equipment written off Waiver of debt by an other payable Unrealised loss on foreign exchange 2,859 1,375,350 1,730,423 1,299,201 1,375,350 1,299,201 123,107 (58,897) 1,386 11,669 30,311 (164,317) 141,615 (42,613) (144,677) 60,706 (3,436,975) 172,517 38,233 Operating profit/(loss) before working capital changes 7,370,749 8,551,914 (1,681,252) (773,802) 80 XOX BHD 1000084 IANNUAL REPORT 2017 Statements of Cash Flows for the Financial Year Ended 30 June 2017 (Cont'd) 2017 RM Group 2016 RM Company 2017 2016 RM RM Note Changes in working capital: Inventories Trade receivables Other receivables Trade payables Other payables (5,312,459) 503,004 2,930,672 3,936,439 (15,359,578) (8,170,692) 4,192,600 (19,085,659) 1,903,715 (5,240,284) (26,280) 805,655 (17,523) (84,863 (11,645,050) (28,057,192) (43,803) 720,792 Cash used in operations (4,274,301) (19,505,278) (1,725,055) (53,010) 42,613 144,677 Interest received Interest paid Tax paid Tax refund 58,897 164,317 (123,107) (30,311) (518,398) (1,060,115) 183,674 6,643 (19,481) (18,789) 255 (398,934) (919,466) 23,132 126,143 Net cash (used in)/from operating activities (4,673,235) (20,424,744) (1,701,923) 73,133 (6,000,000) (2,409,751) Cash Flows From Investing Activities Acquisition of property, plant and equipment 4(a) (23,212,039) (23,918,344) Acquisition of other investments (6,000,000) (2,409,751) Proceeds from disposal of other investments 1,344,344 Net cash (outflow)/Proceeds from disposal of a subsidiary company (1,376) Proceeds from disposal of property, plant and equipment 70.530 8,750 Advance to subsidiary companies 1,344,344 1 (29,566,592) (44,963,989) Net cash used in investing activities (27,797,165) (26,320,721) (34,222,248) (47,373,739) ANNUAL REPORT 2017 XOX BHD 900354-XI 81 Statements of Cash Flows for the Financial Year Ended 30 June 2017 (Cont'd) 2017 RM Group 2016 RM Company 2017 2016 RM RM (440,414) (248,276) Cash Flows From Financing Activities Repayment of finance lease payables Repayment to subsidiary companies Proceeds from issuance of shares capital Utilisation of share premium for share issuance expenses (857,705) (698,841) 29,009,135 59,082,936 29,009,135 59,082,936 (901,275) (901,275) Net cash from financing activities 28,568,721 57,933,385 28,151,430 57,482,820 (3,901,679) 11,187,920 (7,772,741) Net (decrease]/increase in cash and cash equivalents Cash and cash equivalents at the beginning of the financial year 10,182,214 20,494,686 9,306,766 10,197,667 15,453 Cash and cash equivalents at the end of the financial year 16,593,007 20,494,686 2,424,926 10,197,667 Cash and cash equivalents at the end of the financial year comprises: Short-term investments Fixed deposits with a licensed bank Cash and bank balances 21,465 10,169 10,084,792 10,388,429 16,593,007 10,084,792 102,706 2,424,926 16,593,007 20,494,686 2,424,926 10,197,667 The accompanying notes form an integral part of the financial statements. 72 XOX BHD 1000384 XI ANNUAL REPORT 2017 STATEMENTS OF FINANCIAL POSITION AS AT 30 JUNE 2017 2017 RM Group 2016 RM Company 2017 2016 RM RM Note Non-Current Assets Property, plant and equipment Investments in subsidiary 4 70,310,555 51,594,023 companies 5 6 5,735,200 60,002 5,735,200 1,110,550 2,859 60,002 1,110,550 Other investments Goodwill on consolidation 76,045,755 52,707,432 5,795,202 1,170,552 8 9 10 7,585,943 15,696,685 31,917,320 2,274,870 20,357,780 16,557,746 27,281 1,001 Current Assets Inventories Trade receivables Other receivables Amounts owing by subsidiary companies Tax recoverable Short-term investments Fixed deposits with a licensed bank Cash and bank balances 11 80,590,820 38,267 404,487 405,008 21,465 51,024,228 18,786 10,169 12 13 10,084,792 10,084,792 10,388,429 16,593,007 2,424,926 102,706 72,201,442 60,090,090 83,081,294 61,241,682 Total Assets 148, 247,197 112,797,522 88,876,496 62,412,234 ANNUAL REPORT 2017 XOX BHD SC0334-XI 73 Statements of Financial Position As At 30 June 2017 2017 RM Group 2016 RM Company 2017 2016 RM RM Note Equity Share capital Reserves 14 15 107,637,181 1,427,699 55,641,468 107,437,179 22,387,187 (18,790,463) 55,641,468 5,665,758 Equity attributable to owners of the parent Non-controlling interests 88,646,716 61,307,226 109,064,880 605,108 78,028,655 643,549 Total Equity 109,669,988 78,672,204 88,646,716 61,307,226 Non-Current Liabilities Finance lease payables Deferred tax liabilities 16 17 1,721,788 17,698 439,556 13,116 1,739,486 452,672 18 19 25,983,322 10,326,607 21,790,722 11,687,354 229,780 247,303 Current Liabilities Trade payables Other payables Amounts owing to subsidiary companies Finance lease payables Tax payable 857,705 11 16 527,324 470 194,470 100 36,837,723 33,672,646 229,780 1,105,008 Total Liabilities 38,577,209 34,125,318 229,780 1,105,008 Total Equity and Liabilities 148, 247,197 112,797,522 88,876,496 62,412,234 The accompanying notes form an integral part of the financial statements. 74 XOX BHD 1000364-XI ANNUAL REPORT 2017 STATEMENTS OF PROFIT OR LOSS AND OTHER COMPREHENSIVE INCOME FOR THE FINANCIAL YEAR ENDED 30 JUNE 2017 Group 2017 RM 2016 RM Company 2017 2016 RM RM Note Revenue 20 191,648,275 160,750,055 Cost of sales (104,939,547) (89,625,011) Gross profit 86,708,728 71,125,044 Other income 5,064,957 597,815 1,386,957 144,677 Administrative expenses (36,737,907) (40,585,855) (3,056,602) (13,312,648) Selling and distribution expenses (52,587,825) (40,157,417) (408) Profit/(Loss) from operations 2,447,953 (9,020,413) (1,669,645) (13,168,379) Finance cost 21 (123,107) (30,311) Profit/(Loss) before tax 22 2,324,846 (9,050,724) (1,669,645) (13,168,379) Taxation 23 (336,197) (333,857) Net profit/(loss) for the financial year, representing total comprehensive income/ (loss) for the financial year 1,988,649 (9,384,581) (1,669,645) (13,168,379) Net profit/(loss) for the financial year attributable to: Owners of the parent Non-controlling interests 2,027,090 (38,441) (9,575,836) 191,255 1,988,649 (9,384,581) Earnings/(Loss) per share (sen) Basic 24/a) 0.30 (2.66) Diluted 24(b) N/A N/A The accompanying notes form an integral part of the financial statements. Attributable to owners of the parent Non-Distributable Share Issuance Scheme Capital Warrant Other Option Accumulated Reserve Reserve Reserve Reserve Losses RM RM RM RM RM Share Share Capital RM Non- Controlling Interests RM Premium Total RM Total Equity RM Group RM At 1 July 2016 55,641,468 19,340,195 2,200,000 19,740,845 (19,740,845) 10,601,061 (9,754,069) 78,028,655 643,549 78,672,204 Net profit/(loss) for the financial year, representing total comprehensive income/loss) for the financial year 2,027,090 2,027,090 (38,441) 1,988,649 - 23,105,900 Transactions with owners: Issue of ordinary shares - pursuant to private placement 23,105,900 to share options exercised 4,540,950 Realisation of share options - 23,105,900 -pursuant 5,008,668 (3,646,383) 5,903,235 - 5,903,235 (1,023,567) 1,023,567 27,646,850 5,008,668 (4,669,950) 1,023,567 29,009, 135 - 29,009,135 Transition to no-par value regime THE FINANCIAL YEAR ENDED 30 JUNE 2017 24,348,863 (24,348,863) At 30 June 2017 107,637,181 2,200,000 19,740,845 (19,740,845) 5,931,111 (6,703,412) 109,064,880 605,108 109,669,988 ANNUAL REPORT 2017 XOX BHD 500354.81 75 Attributable to owners of the parent Non-Distributable Share Issuance Scheme Capital Warrant Other Option Accumulated Reserve Reserve Reserve Reserve Losses RM RM RM RM RM XOX BHD 900 Share Capital RM Share Premium RM Non- Controlling Interests RM Total RM Total Equity RM Group At 1 July 2015 33,200,000 32,730,251 2,200,000 (49,308,482) 18,821,769 148,585 18,970,354 ANNUAL REPORT 2017 for the Financial Year Ended 30 June 2017 (Cont'd) Statements of Changes in Equity Net loss for the financial year, representing total comprehensive (loss)/income for the financial year (9,575,836) (9,575,836) 191,255 (9,384,581) (16,600,000) . (32,530,249) 16,600,000 32,530,249 Transactions with owners: Capital reduction Share premium reduction Issue of ordinary shares - pursuant to private placement - pursuant to rights issue Share issuance expenses Issue of warrants Disposal of a subsidiary company Share-based payment expenses 19,000,000 20,041,468 20,041,468 (901,275) 19,000,000 40,082,936 (901,275) - 19,000,000 40,082,936 (901,275) 19,740,845 (19,740,845) 303,709 303,709 10,601,061 10,601,061 - 10,601,061 22,441,468 (13,390,056) - 19,740,845 (19,740,845) 10,601,061 49,130,249 68,782,722 303,709 69,086,431 At 30 June 2016 55,641,468 19,340,195 2,200,000 19,740,845 (19,740,845) 10,601,061 (9,754,069) 78,028,655 643,549 78,672,204 The accompanying notes form an integral part of the financial statements. Attributable to owners of the parent Non-Distributable Share Issuance Scheme Capital Warrant Other Option Accumulated Reserve Reserve Reserve Reserve Losses RM RM RM RM RM Share Capital RM Share Premium RM Total Equity RM Company At 1 July 2016 55,641,468 19,140,193 2,200,000 19,740,845 (19,740,845) 10,601,061 (26,275,496) 61,307,226 Net loss for the financial year, representing total comprehensive loss for the financial year (1,669,645) (1,669,645) Transactions with owners: Issue of ordinary shares - pursuant to private placement - pursuant to share options exercised Realisation of share options 23,105,900 4,540,950 5,008,668 (3,646,383) (1,023,567) 23,105,900 5,903,235 1,023,567 (4,669,950) 1,023,567 29,009,135 27,646,850 5,008,668 24,148,861 (24,148,861) Transition to no-par value regime At 30 June 2017 107,437,179 2,200,000 19,740,845 (19,740,845) 5,931,111 (26,921,574) 88,646,716 for the Financial Year Ended 30 June 2017 (Cont'd) Statements of Changes in Equity ANNUAL REPORT 2017 XOX BHD 00354.44 77 Attributable to owners of the parent Non-Distributable Share Issuance Scheme Capital Warrant Other Option Accumulated Reserve Reserve Reserve Reserve Losses RM RM RM RM RM XOX BHD 1900 Share Share Capital Premium RM RM Total Equity RM Company At 1 July 2015 33,200,000 32,530,249 2,200,000 (62,237,366) 5,692,883 for the Financial Year Ended 30 June 2017 (Cont'd) Statements of Changes in Equity ANNUAL REPORT 2017 Net loss for the financial year, representing total comprehensive loss for the financial year (13,168,379) (13,168,379) Share (16,600,000) - (32,530,249) 16,600,000 32,530,249 Transactions with owners: Capital reduction premium reduction Issue of ordinary shares - pursuant to private placement - pursuant to rights issue Share issuance expenses Issued of warrants Share-based payment expenses 19,000,000 20,041,468 20,041,468 (901,275) 19,000,000 40,082,936 (901,275) 19,740,845 (19,740,845) - 10,601,061 10,601,061 22,441,468 (13,390,056) 19,740,845 (19,740,845) 10,601,061 49,130,249 68,782,722 At 30 June 2016 55,641,468 19,140,193 2,200,000 19,740,845 (19,740,845) 10,601,061 (26,275,496) 61,307,226 The accompanying notes form an integral part of the financial statements. ANNUAL REPORT 2017 XOX BHD 900384-XI 79 STATEMENTS OF CASH FLOWS FOR THE FINANCIAL YEAR ENDED 30 JUNE 2017 2017 RM Group 2016 RM Company 2017 2016 RM RM Cash Flows From Operating Activities Profit/(Loss) before tax 2,324,846 (9,050,724) (1,669,645) (13,168,379) 638,991 638,991 6,532,950 5,141,503 10,601,061 10,601,061 (52,473) 122,278 (1,344,344) (1,344,344) (318,613) Adjustments for: Amount due from a former subsidiary company written off Depreciation of property, plant and equipment Share-based payment expenses (Gain)/Loss on disposal of property, plant and equipment Gain on disposal of other investments (Gain)/Loss on disposal of investment in a subsidiary company Impairment loss on: Goodwill - Other investments Trade receivables Other receivables Interest expense Interest income mento Inventories written off Property, plant and equipment written off Waiver of debt by an other payable Unrealised loss on foreign exchange 2,859 1,375,350 1,730,423 1,299,201 1,375,350 1,299,201 123,107 (58,897) 1,386 11,669 30,311 (164,317) 141,615 (42,613) (144,677) 60,706 (3,436,975) 172,517 38,233 Operating profit/(loss) before working capital changes 7,370,749 8,551,914 (1,681,252) (773,802) 80 XOX BHD 1000084 IANNUAL REPORT 2017 Statements of Cash Flows for the Financial Year Ended 30 June 2017 (Cont'd) 2017 RM Group 2016 RM Company 2017 2016 RM RM Note Changes in working capital: Inventories Trade receivables Other receivables Trade payables Other payables (5,312,459) 503,004 2,930,672 3,936,439 (15,359,578) (8,170,692) 4,192,600 (19,085,659) 1,903,715 (5,240,284) (26,280) 805,655 (17,523) (84,863 (11,645,050) (28,057,192) (43,803) 720,792 Cash used in operations (4,274,301) (19,505,278) (1,725,055) (53,010) 42,613 144,677 Interest received Interest paid Tax paid Tax refund 58,897 164,317 (123,107) (30,311) (518,398) (1,060,115) 183,674 6,643 (19,481) (18,789) 255 (398,934) (919,466) 23,132 126,143 Net cash (used in)/from operating activities (4,673,235) (20,424,744) (1,701,923) 73,133 (6,000,000) (2,409,751) Cash Flows From Investing Activities Acquisition of property, plant and equipment 4(a) (23,212,039) (23,918,344) Acquisition of other investments (6,000,000) (2,409,751) Proceeds from disposal of other investments 1,344,344 Net cash (outflow)/Proceeds from disposal of a subsidiary company (1,376) Proceeds from disposal of property, plant and equipment 70.530 8,750 Advance to subsidiary companies 1,344,344 1 (29,566,592) (44,963,989) Net cash used in investing activities (27,797,165) (26,320,721) (34,222,248) (47,373,739) ANNUAL REPORT 2017 XOX BHD 900354-XI 81 Statements of Cash Flows for the Financial Year Ended 30 June 2017 (Cont'd) 2017 RM Group 2016 RM Company 2017 2016 RM RM (440,414) (248,276) Cash Flows From Financing Activities Repayment of finance lease payables Repayment to subsidiary companies Proceeds from issuance of shares capital Utilisation of share premium for share issuance expenses (857,705) (698,841) 29,009,135 59,082,936 29,009,135 59,082,936 (901,275) (901,275) Net cash from financing activities 28,568,721 57,933,385 28,151,430 57,482,820 (3,901,679) 11,187,920 (7,772,741) Net (decrease]/increase in cash and cash equivalents Cash and cash equivalents at the beginning of the financial year 10,182,214 20,494,686 9,306,766 10,197,667 15,453 Cash and cash equivalents at the end of the financial year 16,593,007 20,494,686 2,424,926 10,197,667 Cash and cash equivalents at the end of the financial year comprises: Short-term investments Fixed deposits with a licensed bank Cash and bank balances 21,465 10,169 10,084,792 10,388,429 16,593,007 10,084,792 102,706 2,424,926 16,593,007 20,494,686 2,424,926 10,197,667 The accompanying notes form an integral part of the financial statements
Step by Step Solution
There are 3 Steps involved in it

Get step-by-step solutions from verified subject matter experts