

Question: Analyze and explain each horizontal analysis ( balance sheet and income statement) give explanation in each data. Boston Brewin Coffee Co. Balance Sheet For the
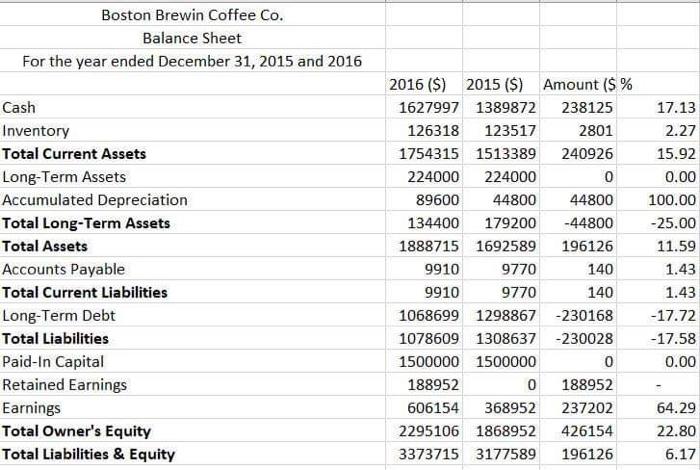
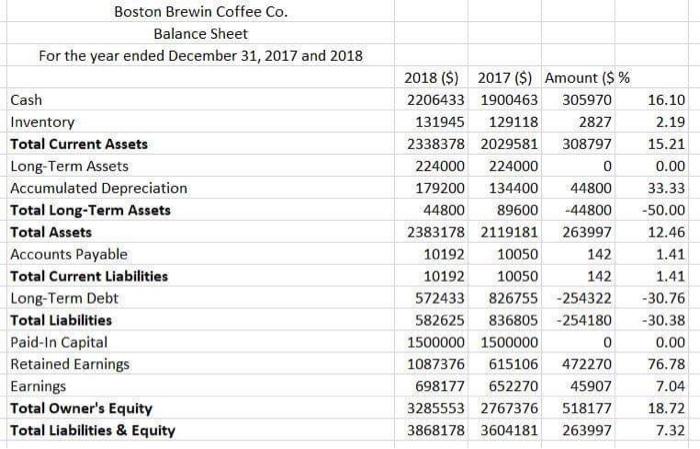
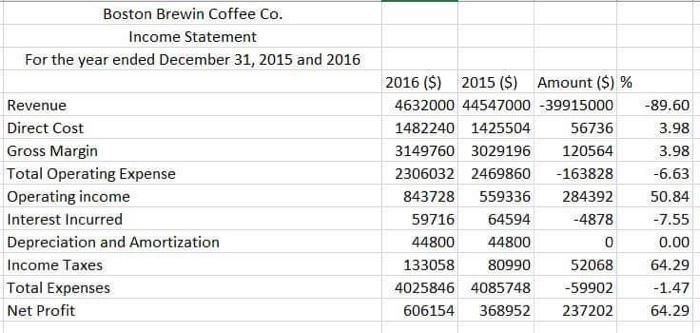
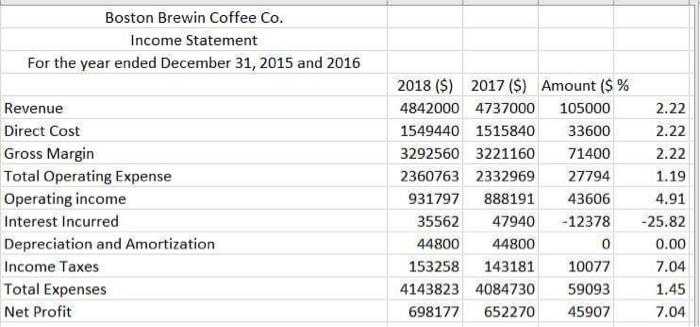
Boston Brewin Coffee Co. Balance Sheet For the year ended December 31, 2015 and 2016 Cash Inventory Total Current Assets Long-Term Assets Accumulated Depreciation Total Long-Term Assets Total Assets Accounts Payable Total Current Liabilities Long-Term Debt Total Liabilities Paid-In Capital Retained Earnings Earnings Total Owner's Equity Total Liabilities & Equity 2016 ($) 2015 ($) Amount ($ % 1627997 1389872 238125 126318 123517 2801 1754315 1513389 240926 224000 224000 0 89600 44800 44800 134400 179200 -44800 1888715 1692589 196126 9910 9770 140 9910 9770 140 1068699 1298867 -230168 1078609 1308637 -230028 1500000 1500000 0 188952 0 188952 606154 368952 237202 2295106 1868952 426154 3373715 3177589 196126 17.13 2.27 15.92 0.00 100.00 -25.00 11.59 1.43 1.43 -17.72 - 17.58 0.00 64.29 22.80 6.17 Boston Brewin Coffee Co. Balance Sheet For the year ended December 31, 2017 and 2018 Cash Inventory Total Current Assets Long-Term Assets Accumulated Depreciation Total Long-Term Assets Total Assets Accounts Payable Total Current Liabilities Long-Term Debt Total Liabilities Paid-In Capital Retained Earnings Earnings Total Owner's Equity Total Liabilities & Equity 2018 ($) 2017 ($) Amount ($ % 2206433 1900463 305970 131945 129118 2827 2338378 2029581 308797 224000 224000 0 179200 134400 44800 44800 89600 -44800 2383178 2119181 263997 10192 10050 142 10192 10050 142 572433 826755 -254322 582625 836805 -254180 1500000 1500000 0 1087376 615106 472270 698177 652270 45907 3285553 2767376 518177 3868178 3604181 263997 16.10 2.19 15.21 0.00 33.33 -50.00 12.46 1.41 1.41 -30.76 -30.38 0.00 76.78 7.04 18.72 7.32 Boston Brewin Coffee Co. Income Statement For the year ended December 31, 2015 and 2016 Revenue Direct Cost Gross Margin Total Operating Expense Operating income Interest Incurred Depreciation and Amortization Income Taxes Total Expenses Net Profit 2016 ($) 2015 ($) Amount ($)% 4632000 44547000 -39915000 1482240 1425504 56736 3149760 3029196 120564 2306032 2469860 -163828 843728 559336 284392 59716 64594 -4878 44800 44800 0 133058 80990 52068 4025846 4085748 -59902 606154 368952 237202 -89.60 3.98 3.98 -6.63 50.84 -7.55 0.00 64.29 -1.47 64.29 Boston Brewin Coffee Co. Income Statement For the year ended December 31, 2015 and 2016 Revenue Direct Cost Gross Margin Total Operating Expense Operating income Interest Incurred Depreciation and Amortization Income Taxes Total Expenses Net Profit 2018 ($) 2017 ($) Amount ($ % 4842000 4737000 105000 1549440 1515840 33600 3292560 3221160 71400 2360763 2332969 27794 931797 888191 43606 35562 47940 -12378 44800 44800 153258 143181 10077 4143823 4084730 59093 698177 652270 45907 2.22 2.22 2.22 1.19 4.91 -25.82 0.00 7.04 1.45 0 7.04
Step by Step Solution
There are 3 Steps involved in it

Get step-by-step solutions from verified subject matter experts