

Question: Analyze and Interpret the companys performance in the previous 3 years in related to the following profitability ratio (Return on Assets ratio)explain which is performing
Analyze and Interpret the companys performance in the previous 3 years in related to the following profitability ratio (Return on Assets ratio)explain which is performing better? and why?
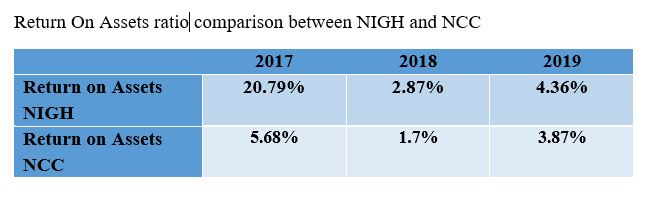
Return On Assets ratio comparison between NIGH and NCC 2017 20.79% 2018 2.87% 2019 4.36% Return on Assets NIGH Return on Assets NCC 5.68% 1.7% 3.87%
Step by Step Solution
There are 3 Steps involved in it
1 Expert Approved Answer
Step: 1 Unlock

Question Has Been Solved by an Expert!
Get step-by-step solutions from verified subject matter experts
Step: 2 Unlock
Step: 3 Unlock