

Question: Analyze and interpret this financial statement using horizontal as tool based on that percentage. APPENDIX APPENDIX year Income Statement Increase or (Decrease) during 2019 19.25%
Analyze and interpret this financial statement using horizontal as tool based on that percentage.
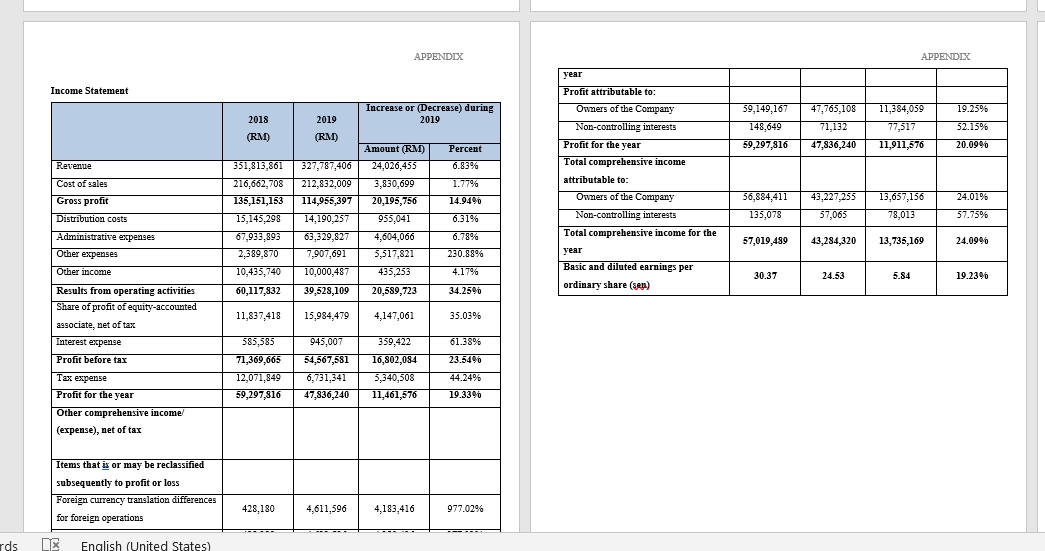
APPENDIX APPENDIX year Income Statement Increase or (Decrease) during 2019 19.25% 2018 2019 (RM) 59,149,167 148,649 47,765,108 71,152 11,384,059 77,317 (RM) 52.15% 20.09% 59,297,816 47,836,240 11,911,576 Revenue Percent 6.83% 1.77% 14.9496 Cost of sales Gross profit Distribution costs Administrative expenses Other expenses Amount (RM) 24,026,455 3,830,699 20,195,756 955,041 4,604,066 5.517.821 435,233 Profit attributable to: Owners of the Company Non-controlling interests Profit for the year Total comprehensive income attributable to: Owners of the Company Non-controlling interests Total comprehensive income for the year Basic and diluted earnings per ordinary share (sen) 56,884,411 135,078 43.227.255 57,065 13,657,156 78,015 351,813,861 327,787,406 216,662,708 212,852.009 212,832,009 135,151,153 114,955,397 15,145,298 14.190.237 67,933.893 63,329,827 2,389,870 7,907,691 10,455,740 10,000,487 60,117,832 39,528,109 24.01% 57.75% 6.31% 57,019,489 43,284,320 13,735,169 24.09% 6.78% 230.88% 4.17% 34.25 Other income 30.37 24.53 24.53 5.84 19.2396 19.2390 20,589,723 11,837,418 15,984,479 4,147,061 35.03% Results from operating activities Share of profit of equity-accounted 299ociate, net of tax Interest expense Profit before tax 359.422 61.389 23.64% 585,385 71,369,665 12,071,849 59,297,816 945,007 54,567,581 6,731,341 47,836,240 Tax expense Profit for the year 16,802,084 5,340,508 11,461,576 44.24% 19.3390 Other comprehensive income (expense), net of tax Items that is or may be reclassified subsequently to profit or loss Foreign currency translation differences for foreign operations 428,180 4,611,596 4,183,416 977.02% rds English (United States) APPENDIX APPENDIX year Income Statement Increase or (Decrease) during 2019 19.25% 2018 2019 (RM) 59,149,167 148,649 47,765,108 71,152 11,384,059 77,317 (RM) 52.15% 20.09% 59,297,816 47,836,240 11,911,576 Revenue Percent 6.83% 1.77% 14.9496 Cost of sales Gross profit Distribution costs Administrative expenses Other expenses Amount (RM) 24,026,455 3,830,699 20,195,756 955,041 4,604,066 5.517.821 435,233 Profit attributable to: Owners of the Company Non-controlling interests Profit for the year Total comprehensive income attributable to: Owners of the Company Non-controlling interests Total comprehensive income for the year Basic and diluted earnings per ordinary share (sen) 56,884,411 135,078 43.227.255 57,065 13,657,156 78,015 351,813,861 327,787,406 216,662,708 212,852.009 212,832,009 135,151,153 114,955,397 15,145,298 14.190.237 67,933.893 63,329,827 2,389,870 7,907,691 10,455,740 10,000,487 60,117,832 39,528,109 24.01% 57.75% 6.31% 57,019,489 43,284,320 13,735,169 24.09% 6.78% 230.88% 4.17% 34.25 Other income 30.37 24.53 24.53 5.84 19.2396 19.2390 20,589,723 11,837,418 15,984,479 4,147,061 35.03% Results from operating activities Share of profit of equity-accounted 299ociate, net of tax Interest expense Profit before tax 359.422 61.389 23.64% 585,385 71,369,665 12,071,849 59,297,816 945,007 54,567,581 6,731,341 47,836,240 Tax expense Profit for the year 16,802,084 5,340,508 11,461,576 44.24% 19.3390 Other comprehensive income (expense), net of tax Items that is or may be reclassified subsequently to profit or loss Foreign currency translation differences for foreign operations 428,180 4,611,596 4,183,416 977.02% rds English (United States)
Step by Step Solution
There are 3 Steps involved in it

Get step-by-step solutions from verified subject matter experts