

Question: Analyze Home Depots Financial Statements and Ratios. Write a 2 paragraph conclusion of your analysis. Look at big number changes. Draw logical conclusions One paragraph
Analyze Home Depots Financial Statements and Ratios. Write a 2
paragraph conclusion of your analysis. Look at big number changes. Draw logical conclusions
One paragraph should be dedicated to the Balance Sheet, and one to the Income Statement.
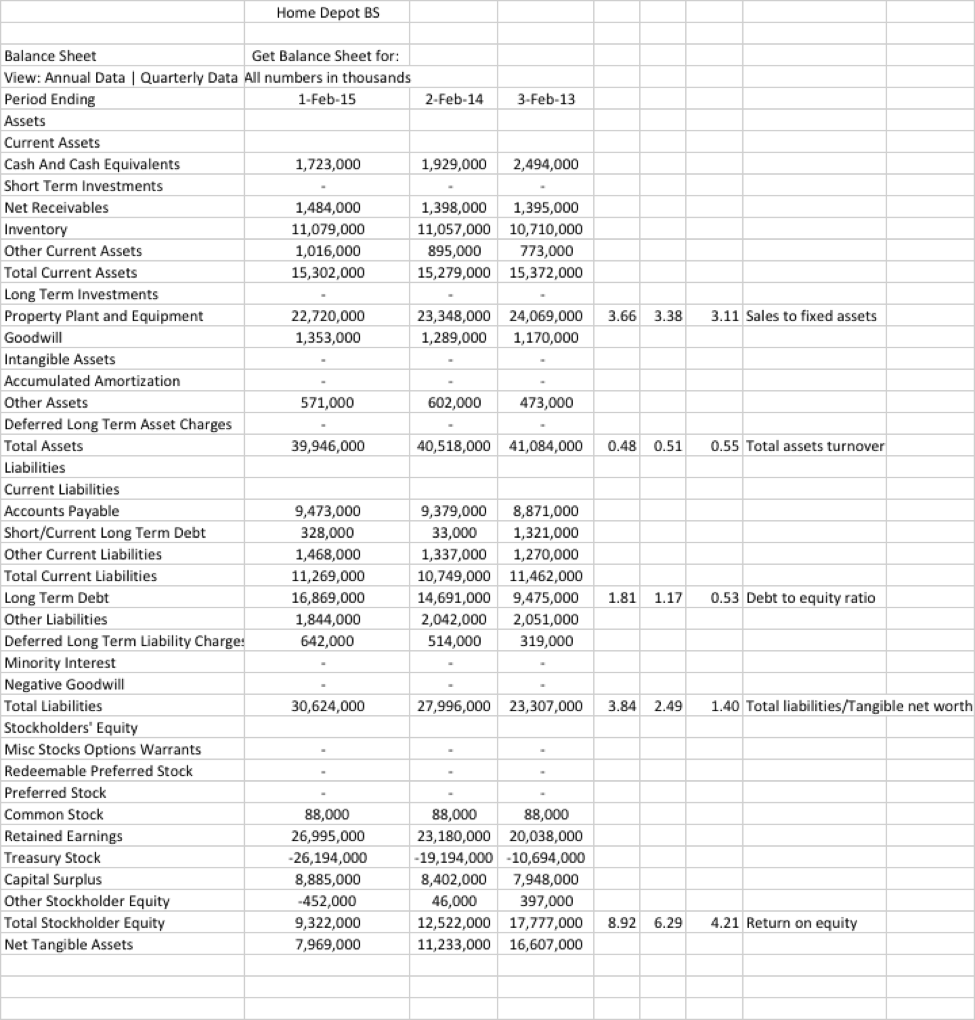
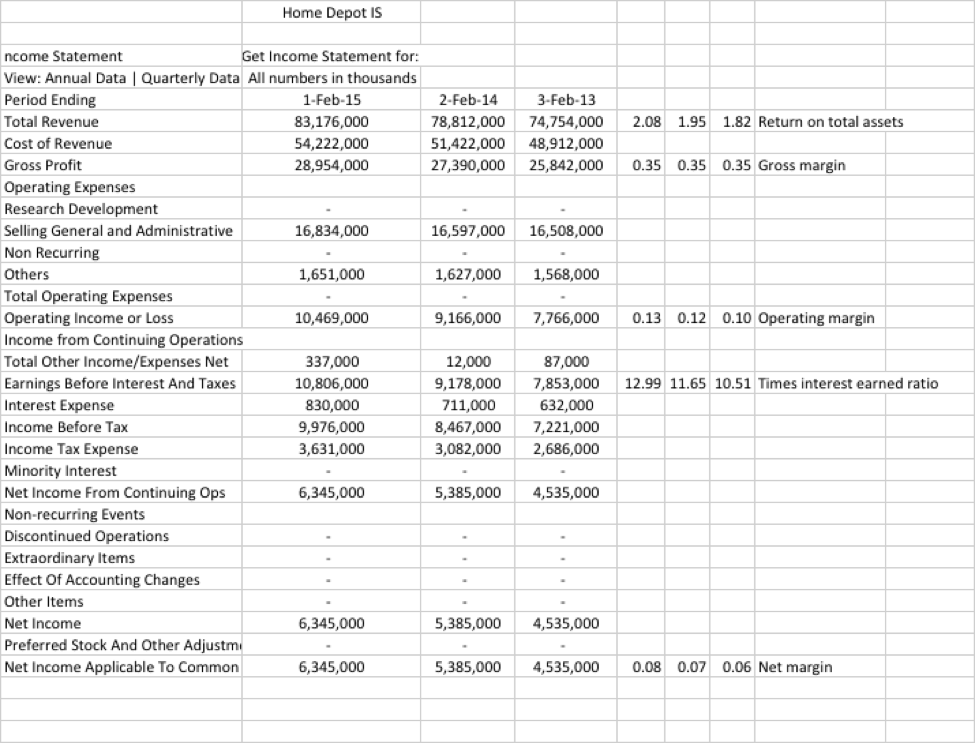
Home Depot BS Balance Sheet View: Annual Data Quarterly Data All numbers in thousands Period Ending Assets Current Assets Cash And Cash Equivalents Short Term Investments Net Receivables Inventory Other Current Assets Total Current Assets Long Term Investments Property Plant and Equipment Goodwill Intangible Assets Accumulated Amortization Other Assets Deferred Long Term Asset Charges Total Assets Liabilities Current Liabilities Accounts Payable Short/Current Long Term Debt Other Current Liabilities Total Current Liabilities Long Term Debt Other Liabilities Deferred Long Term Liability Charges Minority Interest Negative Goodwill Total Liabilities Stockholders' Equity Misc Stocks Options Warrants Redeemable Preferred Stock Preferred Stock Common Stock Retained Earnings Treasury Stock Capital Surplus Other Stockholder Equit Total Stockholder Equit Net Tangible Assets Get Balance Sheet for: 1-Feb-15 2-Feb-14 3-Feb-13 1,723,000 1,929,000 2,494,000 1,484,000 11,079,000 1,016,000 15,302,000 1,398,000 1,395,000 11,057,000 10,710,000 895,000 15,279,000 15,372,000 773,000 22,720,000 1,353,000 23,348,000 24,069,000 3.66 3.383.11 Sales to fixed assets 1,289,000 1,170,000 571,000 602,000 473,000 39,946,000 40,518,000 41,084,000 0.48 0.51 0.55 Total assets turnover 9,473,000 328,000 1,468,000 11,269,000 16,869,000 1,844,000 642,000 9,379,000 8,871,000 33,0001,321,000 1,337,000 1,270,000 10,749,000 11,462,000 14,691,000 9,475,0001.81 1.17 0.53 Debt to equity ratio 2,042,000 2,051,000 14,000319,000 30,624,000 27,996,000 23,307,000 3.84 2.49 1.40 Total liabilities/Tangible net worth 88,000 26,995,000 26,194,000 8,885,000 452,000 9,322,000 7,969,000 88,000 88,000 23,180,000 20,038,000 19,194,000-10,694,000 8,402,000 7,948,000 46,000 12,522,000 17,777,000 8.926.29 4.21 Return on equity 11,233,000 16,607,000 397,000
Step by Step Solution
There are 3 Steps involved in it

Get step-by-step solutions from verified subject matter experts