

Question: Analyze the control chart and state whether or not the process is in control (based upon this information only). Explain how you analyzed the chart
- Analyze the control chart and state whether or not the process is in control (based upon this information only). Explain how you analyzed the chart to
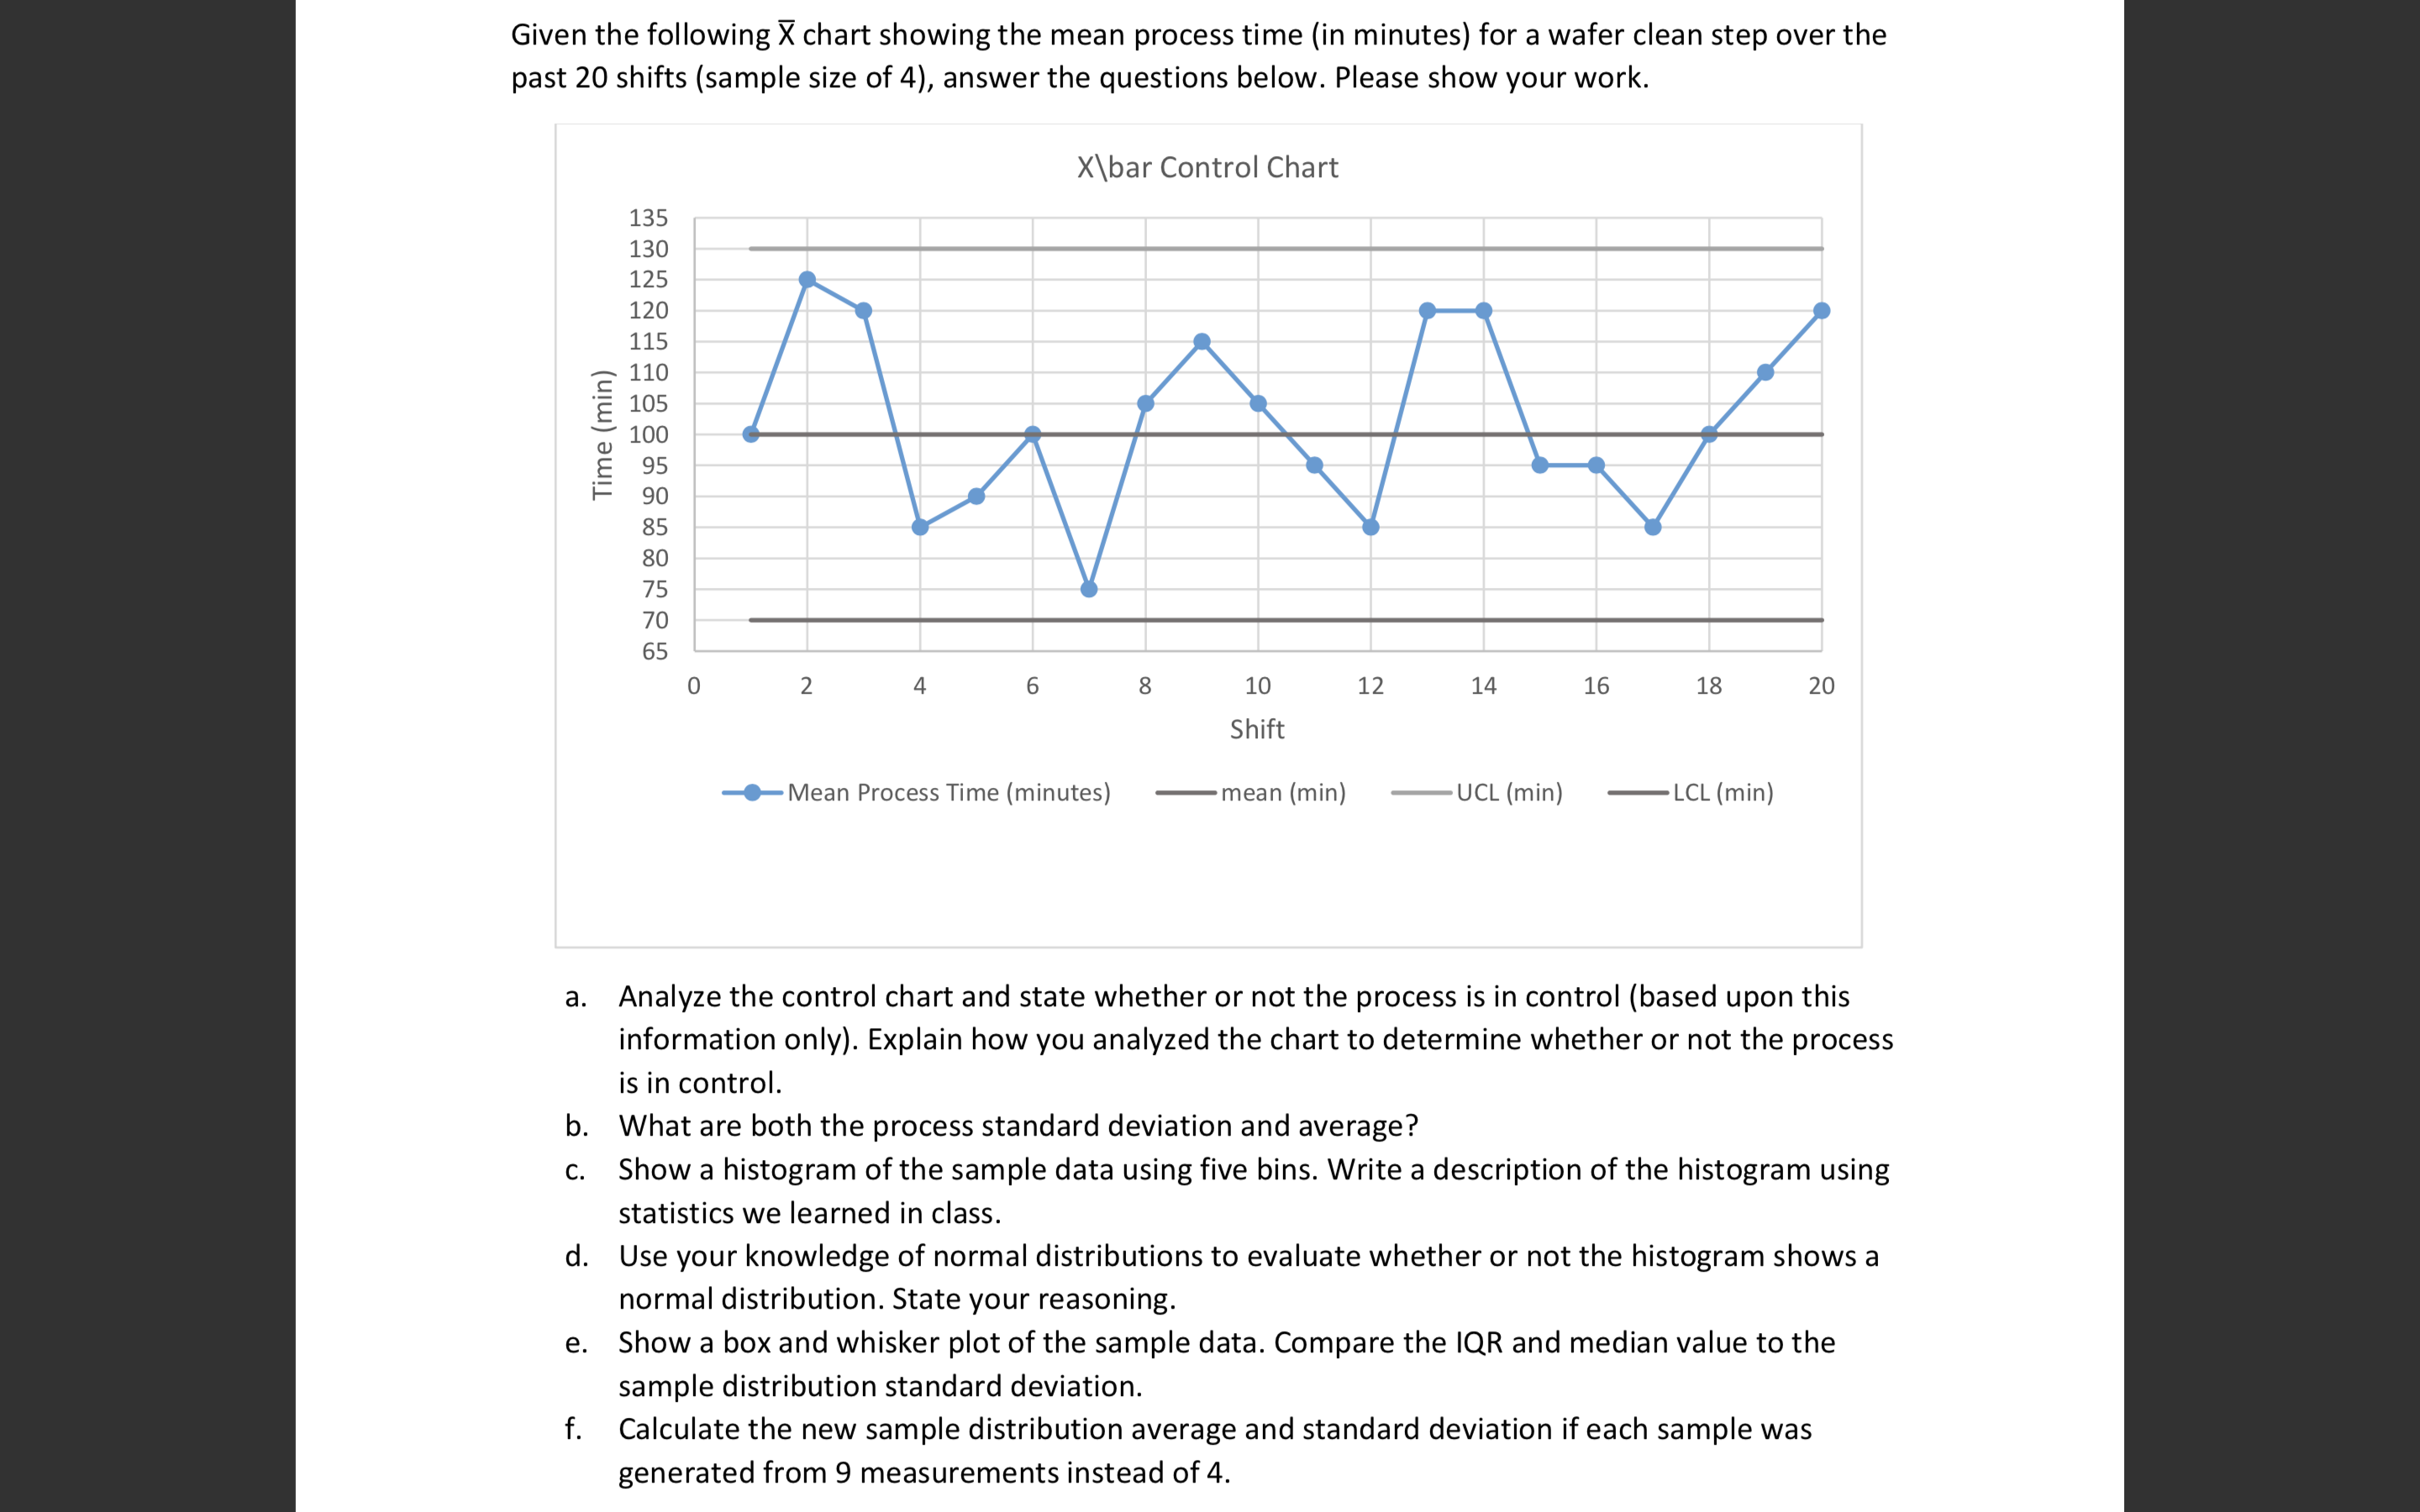
Given the following Y chart showing the mean process time (in minutes) for a wafer clean step over the past 20 shifts (sample size of 4), answer the questions below. Please show your work. X\\bar Control Chart 0 2 4 6 8 10 12 14 16 18 20 Shift +MeanProcessTime(minutes) mean(min) UCL(min) LCL(min) a. Analyze the control chart and state whether or not the process is in control (based upon this information only). Explain how you analyzed the chart to determine whether or not the process is in control. b. What are both the process standard deviation and average? Show a histogram of the sample data using five bins. Write a description of the histogram using statistics we learned in class. d. Use your knowledge of normal distributions to evaluate whether or not the histogram shows a normal distribution. State your reasoning. e. Show a box and whisker plot of the sample data. Compare the IQR and median value to the sample distribution standard deviation. f. Calculate the new sample distribution average and standard deviation if each sample was generated from 9 measurements instead of 4
Step by Step Solution
There are 3 Steps involved in it

Get step-by-step solutions from verified subject matter experts