

Question: analyze the data in the problems listed below using median and up/down run tests with z=+-2 Analyze the data in the following problems using median
 analyze the data in the problems listed below using median and up/down run tests with z=+-2
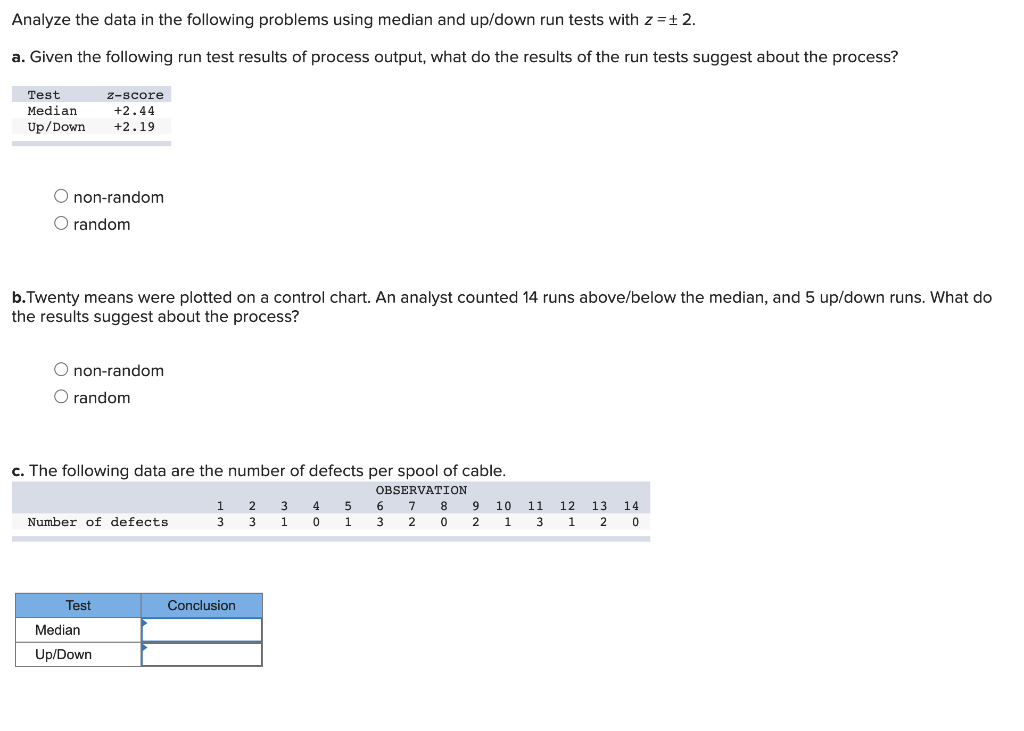
Analyze the data in the following problems using median and up/down run tests with z=2. a. Given the following run test results of process output, what do the results of the run tests suggest about the process? non-random random b. Twenty means were plotted on a control chart. An analyst counted 14 runs above/below the median, and 5 up/down runs. What do the results suggest about the process? non-random random c. The following data are the number of defects per spool of cable. Analyze the data in the following problems using median and up/down run tests with z=2. a. Given the following run test results of process output, what do the results of the run tests suggest about the process? non-random random b. Twenty means were plotted on a control chart. An analyst counted 14 runs above/below the median, and 5 up/down runs. What do the results suggest about the process? non-random random c. The following data are the number of defects per spool of cable
Step by Step Solution
There are 3 Steps involved in it

Get step-by-step solutions from verified subject matter experts