Analyze the data provided and answer the following questions;
- What key concept or technique from data provided can be used to utilize in the quarter's decisions?
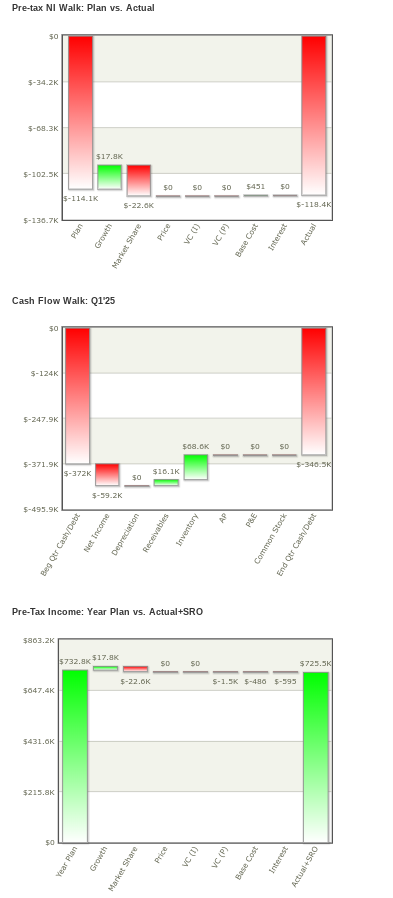
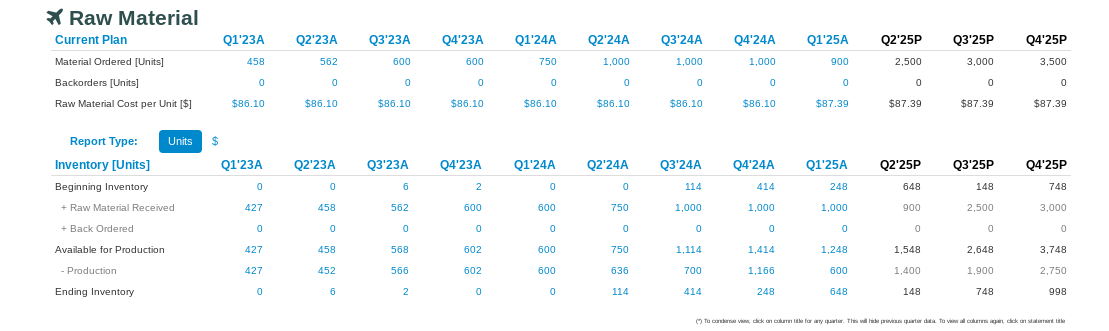
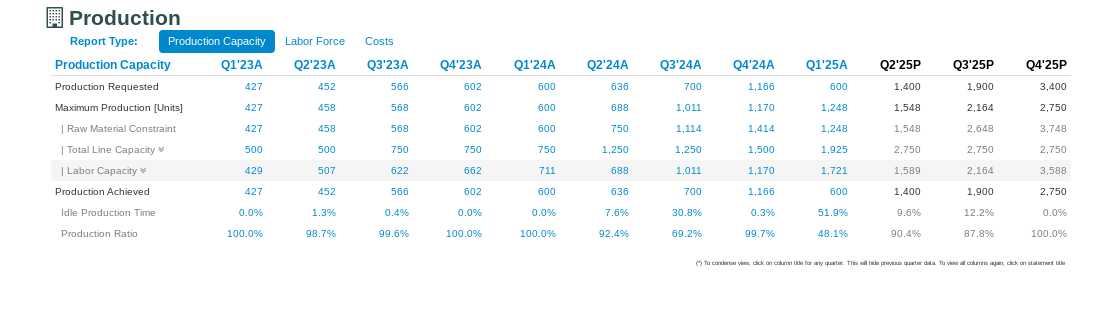
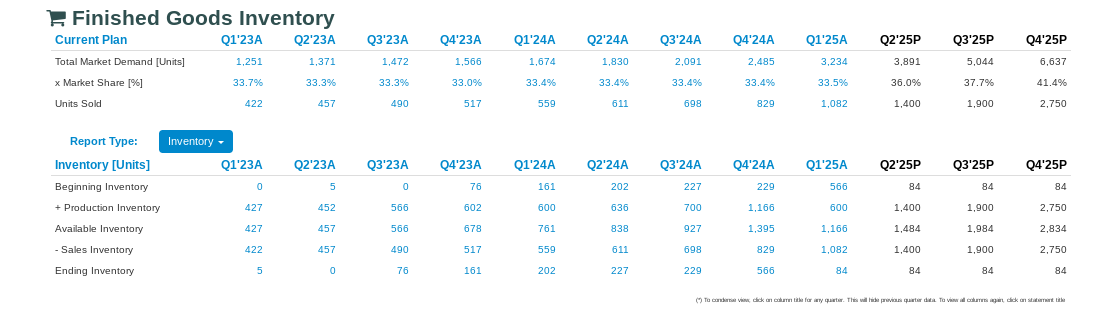
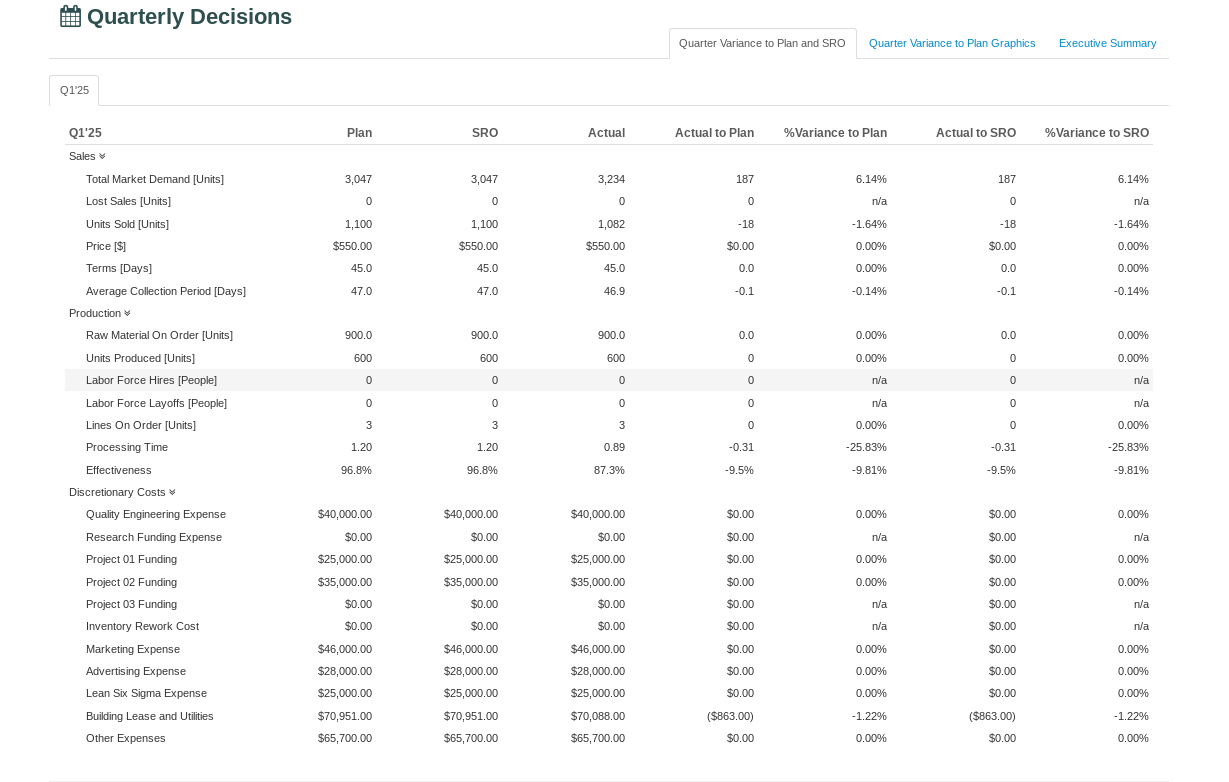
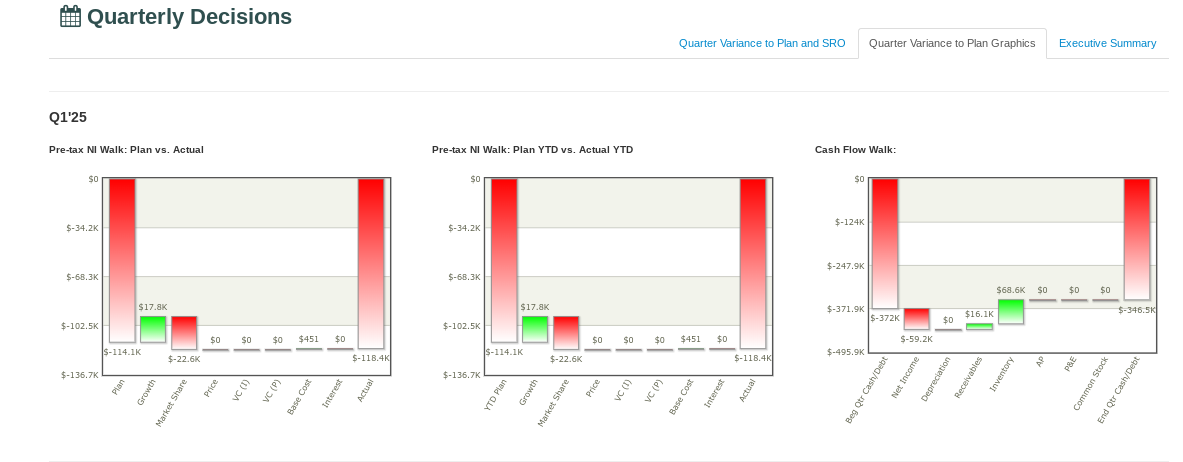
Pre-tax NI Walk: Plan vs. Actual $0 $-34.2K $-08.3K $17.8K $-102.5K SO $451 5-114.1K 5-22.OK $-118.4K $-134.7K Pian Price Growth VC () VC (P) Interest Actual Base Cost Market Share Cash Flow Walk: Q125 $-124K $-247.9K $48.CK 50 50 $-371.9K 4-340.5K $-372K $10.1K 5-39.2K $-495.9K PRE Net Income Inventory Depreciation Receivables Common Stock Beg Qir Cash/Debt End Qir Cash/Debt Pre-Tax Income: Year Plan vs. Actual+SRO $803.2K $732.9K$17.8K $725.5K $-22.OK 5-1.3K $-480 $-395 $047.4K $431.OK $215.8K Price Growth vc (1) VC ( P ) Year Plan Interest Base Cost Market Share Actual +SRC* Raw Material Current Plan Q1'23A Q2'23A Q3'23A Q4'23A Q1'24A Q2'24A Q3'24A Q4'24A Q1'25A Q2'25P Q3'25P Q4'25P Material Ordered [Units] 158 562 600 600 750 1,000 1,000 1,000 900 2,500 3,000 3,500 Backorders [Units] 0 0 0 0 0 0 0 0 Raw Material Cost per Unit [$] $86.10 $86.10 $86.10 $86.10 $86.10 $86.10 $86.10 $86.10 $87.39 $87.39 $87.39 $87.39 Report Type: Units Inventory [Units] Q1'23A Q2'23A Q3'23A Q4'23A Q1'24A Q2'24A Q3'24A Q4'24A Q1'25A Q2'25P Q3'25P Q4'25P Beginning Inventory 0 6 2 0 114 414 248 648 148 748 + Raw Material Received 427 458 562 600 600 750 1,000 1,000 1,000 900 2,500 3,000 + Back Ordered 0 0 0 0 0 0 0 0 0 0 0 Available for Production 427 158 568 602 600 750 1,114 1,414 1,248 1,548 2,648 3,748 - Production 427 452 566 602 600 636 700 1,166 600 1,400 1,900 2,750 Ending Inventory 0 6 2 0 0 114 414 248 648 148 748 998 () To condemn vi, click on column title for any quieter. The all hike previan quarter diva To view ad cokman again, click on statement tikProduction Report Type: Production Capacity Labor Force Costs Production Capacity Q1'23A Q2'23A Q3'23A Q4'23A Q1'24A Q2'24A Q3'24A Q4'24A Q1'25A Q2'25P Q3'25P Q4'25P Production Requested 427 452 566 602 600 536 700 1,166 600 1,400 1,900 3,400 Maximum Production [Units] 427 458 568 602 600 688 1,011 1,170 1,248 1,548 2,164 2,750 | Raw Material Constraint 427 458 568 602 600 750 1,114 1,414 1,248 1,548 2,648 3,748 | Total Line Capacity * 500 500 750 750 750 1,250 1,250 1,500 1,925 2,750 2,750 2,750 | Labor Capacity * 429 507 622 662 711 688 1,011 1,170 1,721 1,589 2,164 3,588 Production Achieved 427 452 566 602 600 536 700 1,166 600 1,400 1,900 2,750 Idle Production Time 0.0% 1.3% 0.4% 0.0% 0.0% 7.6% 30.8% 0.3% 51.9% 9.6% 12.2% 0.0% Production Ratio 100.0% 98.7% 99.6% 100.0% 100.0% 92.4% 69.2% 99.7% 48.1% 90.4% 87.8% 100.0% () To condemnin view, click on corn title for any quieter. This wl hide previan quarter data To view id cokmrs again, click on statement tikFinished Goods Inventory Current Plan Q1'23A Q2'23A Q3'23A Q4'23A Q1'24A Q2'24A Q3'24A Q4'24A Q1'25A Q2'25P Q3'25P Q4'25P Total Market Demand [Units] 1,251 1,371 1,472 1,566 1,674 1,830 2,091 2,485 3,234 3,891 5,044 6,637 x Market Share [%] 33.7% 33.3% 33.3% 33.0% 33.4% 33.4% 33.4% 33.4% 33.5% 36.0% 37.7% 41.4% Units Sold 422 457 490 517 559 611 698 829 1,082 1,400 1,900 2,750 Report Type: Inventory ~ Inventory [Units] Q1'23A Q2'23A Q3'23A Q4'23A Q1'24A Q2'24A Q3'24A Q4'24A Q1'25A Q2'25P Q3'25P Q4'25P Beginning Inventory 0 5 0 76 161 202 227 229 566 84 84 84 + Production Inventory 427 452 566 602 600 636 700 1,166 600 1,400 1,900 2,750 Available Inventory 427 457 566 678 761 838 927 1,395 1,166 1,484 1,984 2.834 - Sales Inventory 422 457 190 517 559 611 698 129 1,082 1,400 1,900 2,750 Ending Inventory 5 0 76 161 202 227 229 566 84 84 B4 84 () To carkirin vin, click on column title for any quieter. This will hick privvian quarter diva To view id culmin again, click on statement tikQuarterly Decisions Quarter Variance to Plan and SRO Quarter Variance to Plan Graphics Executive Summary Q1'25 Q1'25 Plan SRO Actual Actual to Plan % Variance to Plan Actual to SRO % Variance to SRO Sales Total Market Demand [Units] 3,047 3,047 3,234 187 6.14% 187 6.14% Lost Sales [Units] 0 na na Units Sold [Units] 1,100 1,100 1,082 -18 1.64% -18 -1.64% Price [$] $550.00 $550.00 $550.00 $0.00 0.00% $0.00 0.00% Terms [Days] 45.0 45.0 45.0 0.0 0.00% 0.0 0.00% Average Collection Period [Days] 47.0 47.0 46.9 -0.1 -0.14% -0.1 0.14% Production * Raw Material On Order [Units] 900.0 900.0 900.0 0.0 0.00% 0. 0.00% Units Produced [Units] 600 600 600 0 0.00% 0 0.00% Labor Force Hires [People] 0 0 0 0 na 0 na Labor Force Layoffs [People] 0 0 0 0 n/a 0 n/a Lines On Order [Units] 3 3 0.00% 0.00% Processing Time 1.20 1.20 1.89 0.31 25.83% 0.31 25.83% Effectiveness 96.8% 96.8% 87.3% -9.5% 9.81% 9.5% -9.81% Discretionary Costs * Quality Engineering Expense $40,000.00 $40,000.00 $40,000.00 $0.00 0.00% $0.00 0.00% Research Funding Expense $0.00 $0.00 $0.00 $0.00 n/a $0.00 n/a Project 01 Funding $25,000.00 $25,000.00 $25,000.00 $0.00 0.00% $0.00 0.00% Project 02 Funding $35,000.00 $35,000.00 $35,000.00 $0.00 0.00% $0.00 0.00% Project 03 Funding $0.00 $0.00 $0.00 $0.00 na $0.00 Inventory Rework Cost $0.00 $0.00 $0.00 $0.00 na $0.00 na Marketing Expense $46,000.00 $46,000.00 $46,000.00 $0.00 0.00% $0.00 0.00% Advertising Expense $28,000.00 $28,000.00 $28,000.00 $0.00 0.00% $0.00 0.00% Lean Six Sigma Expense $25,000.00 $25,000.00 $25,000.00 $0.00 0.00% $0.00 0.00% Building Lease and Utilities $70,951.00 $70,951.00 $70,088.00 ($863.00) 1.22% ($863.00) -1.22% Other Expenses $65,700.00 $65,700.00 $65,700.00 $0.00 0.00% $0.00 0.00%Quarterly Decisions Quarter Variance to Plan and SRO Quarter Variance to Plan Graphics Executive Summary Q1'25 Pre-tax NI Walk: Plan vs. Actual Pre-tax NI Walk: Plan YTD vs. Actual YTD Cash Flow Walk: SO $O $-34.2K $-34.2K $-124K $-247.9K $-68.3K $-68.3K $68.6K SO SO $17.8k $17.8k $-371.9K $-346.5K $-372K $0 $16.1K $-102.5K $-102.5K SO $451 $451 $0 5-59.2K $-114.1K $-114.1K $-495.9K $-22.6K $-118.4K $-22.6K $-118.4K Ap P&E $-136.7K $-136.7K Inventory Net Income Depreciation Receivables Common Stock Plan Price Price Growth VC ( ) VC ( P) Interest Actua Growth VC () VC ( P) Actual Beg Qtr Cash/Debt End Qtr Cash/Debt Base Cost YTD Plan Base Cost Interest Market Share Market Share