

Question: Analyze the following data, calculate the the normal time for each element then the Normal and standard time for this process. begin{tabular}{|r|r|r|r|r|r|} hline & &
Analyze the following data, calculate the the normal time for each element then the Normal and standard time for this process.
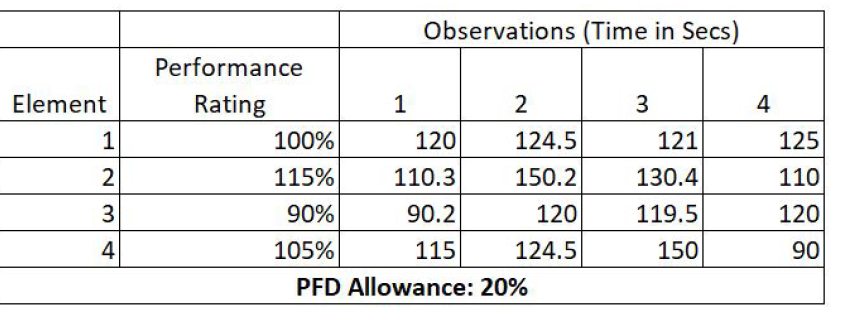
\begin{tabular}{|r|r|r|r|r|r|} \hline & & \multicolumn{4}{|c|}{ Observations (Time in Secs) } \\ \hline \multirow{2}{*}{ Element } & PerformanceRating & \multicolumn{1}{|c|}{1} & \multicolumn{1}{c|}{2} & \multicolumn{1}{c|}{3} & \multicolumn{1}{c|}{4} \\ \hline 1 & 100% & 120 & 124.5 & 121 & 125 \\ \hline 2 & 115% & 110.3 & 150.2 & 130.4 & 110 \\ \hline 3 & 90% & 90.2 & 120 & 119.5 & 120 \\ \hline 4 & 105% & 115 & 124.5 & 150 & 90 \\ \hline \end{tabular} PFD Allowance: 20%
Step by Step Solution
There are 3 Steps involved in it
1 Expert Approved Answer
Step: 1 Unlock

Question Has Been Solved by an Expert!
Get step-by-step solutions from verified subject matter experts
Step: 2 Unlock
Step: 3 Unlock