

Question: analyze the following key statistics and explain them 1) 2) 3) 4) Revenue 142.11M EBITDA 15.28M Net Income 2.73M Return on Capital % 1.15 Enterprise
analyze the following key statistics and explain them
1)
2)
3)
4)
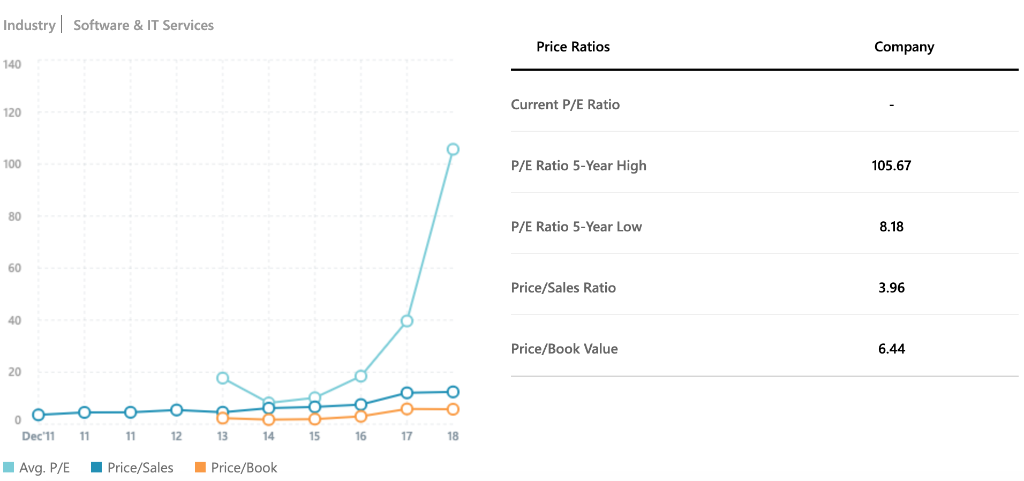
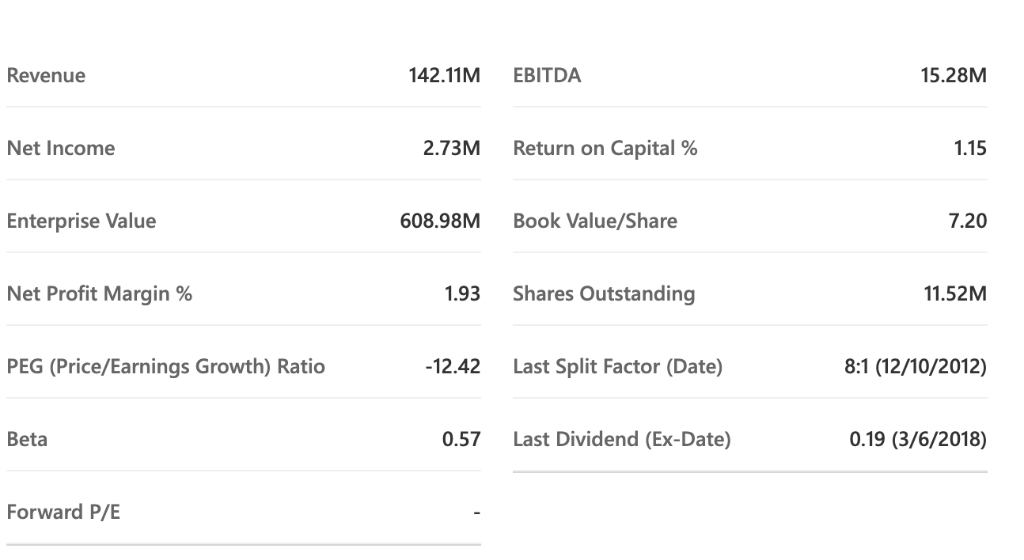
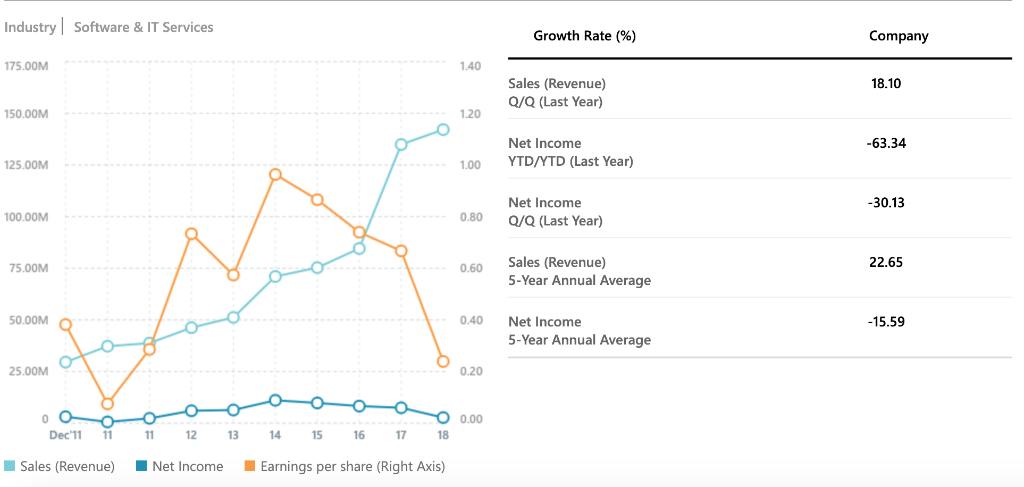
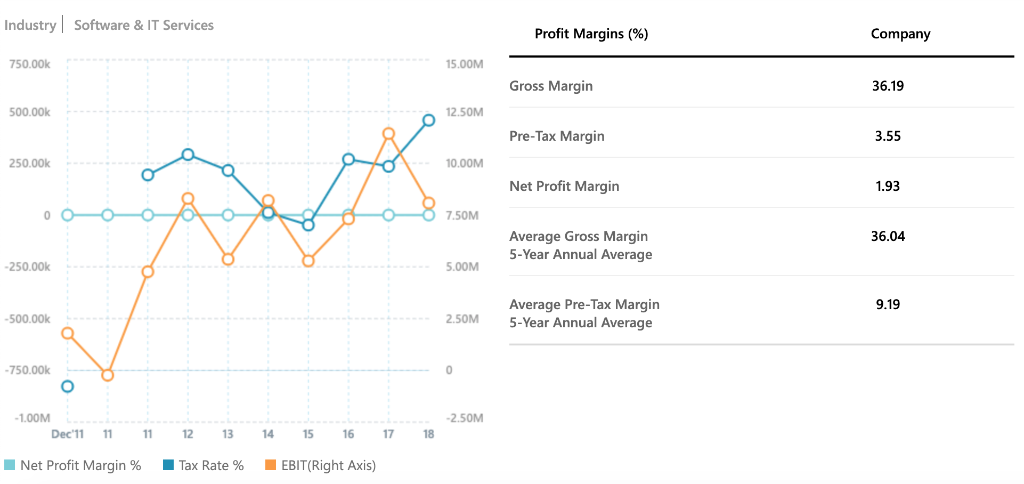
Revenue 142.11M EBITDA 15.28M Net Income 2.73M Return on Capital % 1.15 Enterprise Value 608.98M Book Value/Share 7.20 Net Profit Margin % 1.93 Shares Outstanding 11.52M PEG (Price/Earnings Growth) Ratio -12.42 Last Split Factor (Date) 8:1 (12/10/2012) Beta 0.57 Last Dividend (Ex-Date) 0.19 (3/6/2018) Forward P/E Industry Software & IT Services Growth Rate (%) Company 175.00M 18.10 Sales (Revenue) Q/Q (Last Year) 150.00M -63.34 Net Income YTD/YTD (Last Year) 125.00M 1.00 -30.13 100.00M 0.80 Net Income Q/Q (Last Year) 75.00M 0.60 22.65 Sales (Revenue) 5-Year Annual Average 50.00M O 10.40 -15.59 Net Income 5-Year Annual Average 25.00M 0.20 oooo 0.00 11 12 13 14 15 16 17 18 Dec'11 11 Sales (Revenue) Net Income Earnings per share (Right Axis) Industry Software & IT Services Profit Margins (%) Company 750.00k 15.00M Gross Margin 36.19 500.00k 12.50M Pre-Tax Margin 3.55 250.00k 10.00M Net Profit Margin 1.93 7.50M 36.04 Average Gross Margin 5-Year Annual Average -250.00k 5.00M 9.19 -500.00k 2.50M Average Pre-Tax Margin 5-Year Annual Average -750.00k -2.50M - 1.00M Dec'11 11 11 12 13 14 15 16 17 18 Net Profit Margin % Tax Rate% EBIT(Right Axis) Industry Software & IT Services Price Ratios Company Current P/E Ratio P/E Ratio 5-Year High 105.67 P/E Ratio 5-Year Low 8.18 Price/Sales Ratio 3.96 Price/Book Value 6.44 Dec 11 11 11 12 13 14 15 16 17 18 Avg. P/E Price/Sales Price/Book
Step by Step Solution
There are 3 Steps involved in it

Get step-by-step solutions from verified subject matter experts