

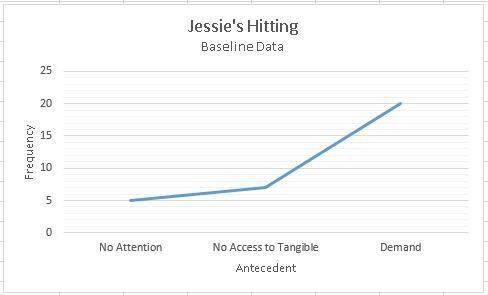
Analyze the following three graphic data displays and respond to the following: In the graph below, identify
Fantastic news! We've Found the answer you've been seeking!
Question:
Analyze the following three graphic data displays and respond to the following:
- In the graph below, identify the probable function of the target behavior.
- Identify the level of the target behavior for each antecedent.
- Based upon the information you have gained from your visual analysis of the graph, discuss how you would address the behavior based upon the function.
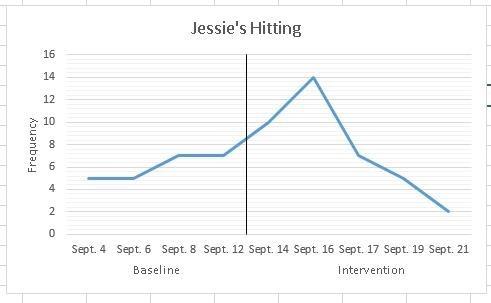
- In the line graph below, identify the data's level and trend during baseline and intervention.
- Discuss the change in level upon beginning the intervention with regard to extinction programs?
- Discuss if this intervention would be considered successful and your rationale.
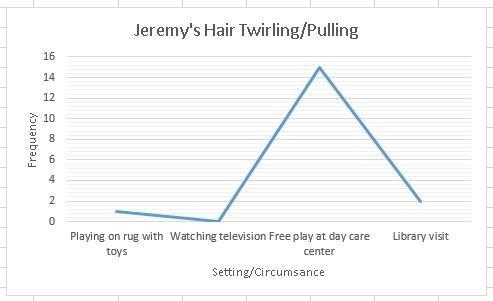
- Jeremy's self-stimulatory behavior, pulling his hair while twirling it, occurs multiple times throughout the day. His parents and daycare teacher have been recording data on the occurrence of the behavior and the settings/circumstances in which it occurs.
- Review the line graphs below. Identify the settings/circumstances in which Jeremy's self-stimulatory behavior occurs most frequently from a visual analysis of the data. Compare the levels with regard to the environments in which the self-stimulatory behavior occurs.
- Hypothesize a possible antecedent for this behavior and discuss a possible antecedent modification to reduce this behavior.
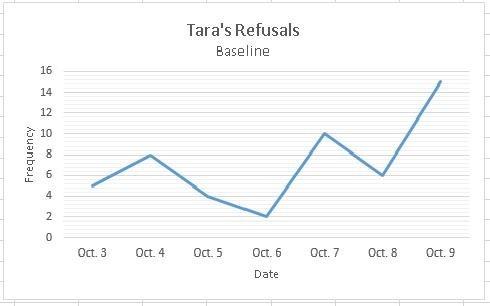
- Through visual analysis of the line graph (below), determine whether the behavior has reached a "steady state."
- Discuss the importance of allowing baseline data to reach a steady state before beginning the intervention?
Expert Answer:
Probable Function of the Target Behavior Hitting The probable function of Jessies hitting behavior appears to be escape or avoidance The hitting behavior increases significantly when a demand is place... View the full answer

Related Book For 

Molecular Cell Biology
ISBN: 978-1429234139
7th edition
Authors: Harvey Lodish, Arnold Berk, Chris A. Kaiser, Monty Krieger, Anthony Bretscher, Hidde Ploegh, Angelika Amon, Matthew P. Scott
Posted Date:
