

Question: Analyze the graph and answer the following questions after analyzing the graph: Complete using data from the spreadsheet. File Home Insert Draw Page Layout Formulas
Analyze the graph and answer the following questions after analyzing the graph:
Complete using data from the spreadsheet.
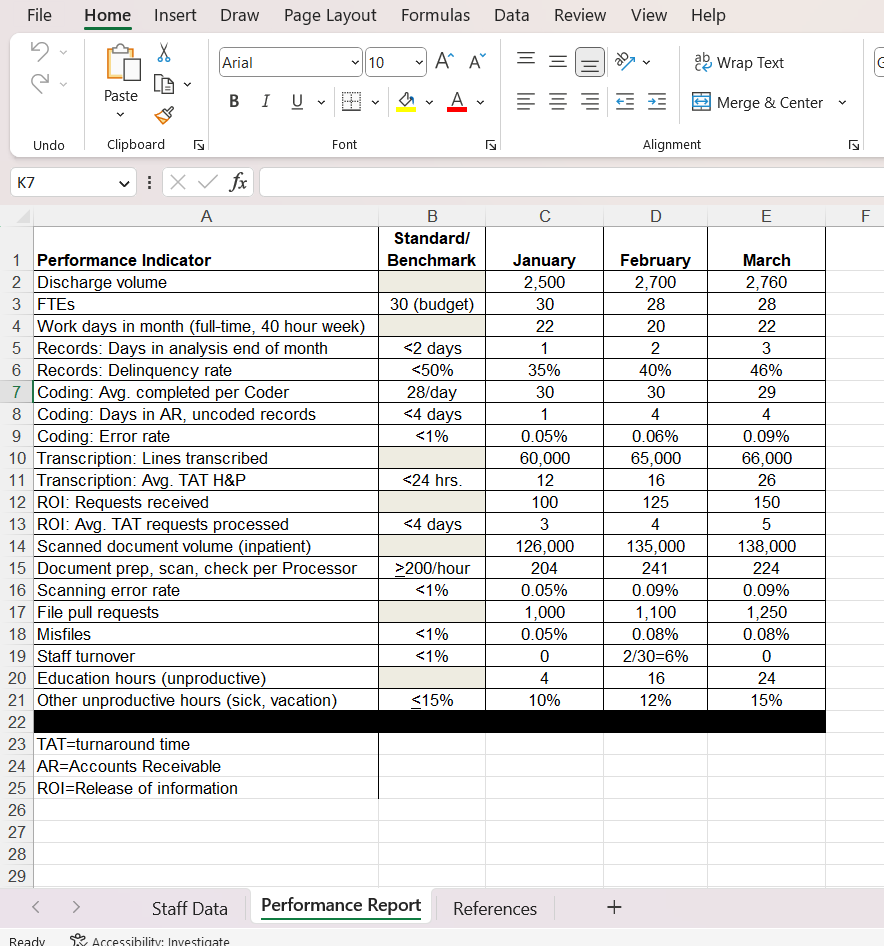
File Home Insert Draw Page Layout Formulas Data Review View Help Arial * 10 YAA ab Wrap Text Paste BIU~ E Merge & Center Undo Clipboard Font Alignment K7 v i XV fx A B C D E F Standard/ 1 Performance Indicator Benchmark January February March Discharge volume 2,500 2,700 2,760 FTEs 30 (budget) 30 1AWN 28 Work days in month (full-time, 40 hour week) 22 20 22 Records: Days in analysis end of month 200/hour 204 241 224 16 Scanning error rate
Step by Step Solution
There are 3 Steps involved in it
1 Expert Approved Answer
Step: 1 Unlock

Question Has Been Solved by an Expert!
Get step-by-step solutions from verified subject matter experts
Step: 2 Unlock
Step: 3 Unlock