

Question: Analyze the graphs below and write a reflection on what you think the graphs are communicating to you. To guide you with your response,
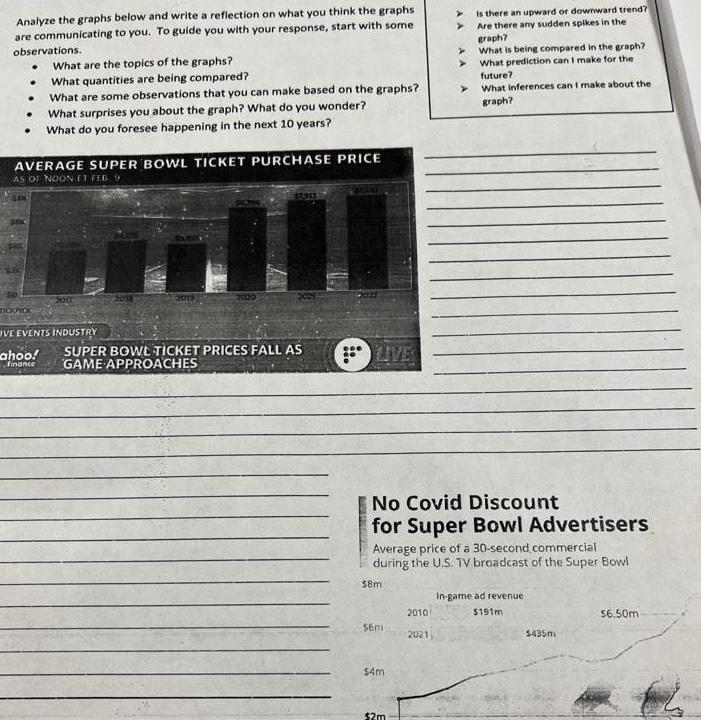
Analyze the graphs below and write a reflection on what you think the graphs are communicating to you. To guide you with your response, start with some observations. . . . What are the topics of the graphs? . What quantities are being compared? What are some observations that you can make based on the graphs? What surprises you about the graph? What do you wonder? What do you foresee happening in the next 10 years? AVERAGE SUPER BOWL TICKET PURCHASE PRICE AS OF NOON ET FEB 9 TICIONICK 2017 VE EVENTS INDUSTRY ahoo! finance 37313 SUPER BOWL TICKET PRICES FALL AS LIVE GAME APPROACHES 4 < 4 Is there an upward or downward trend? Are there any sudden spikes in the graph? What is being compared in the graph? What prediction can I make for the future? What inferences can I make about the graph? No Covid Discount for Super Bowl Advertisers Average price of a 30-second commercial during the U.S. TV broadcast of the Super Bowl $8m In-game ad revenue 2010 $6m 2021 $4m $2m $191m $6.50m $435m
Step by Step Solution
There are 3 Steps involved in it

Get step-by-step solutions from verified subject matter experts