

Question: Analyze the intersection shown in Figure 1 using the HCM methodology. Clearly provide your results for Parts a and b in a table. ( Suggestion:
Analyze the intersection shown in Figure using the HCM methodology. Clearly provide your results for Parts a and b in a table. Suggestion: Using Excel would be helpful in keeping track of the calculations
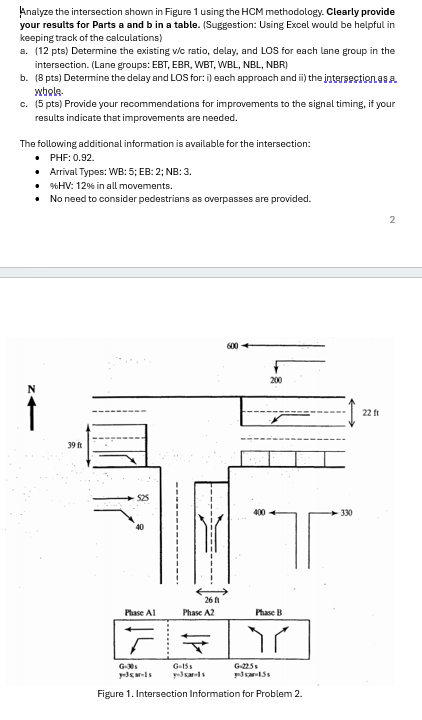
a pts Determine the existing mathrmvmathrmc ratio, delay, and LOS for each lane group in the intersection. Lane groups: EBT, EBR, WBT WBL NBL NBR
b pts Determine the delay and LOS for:i each approach and ii the intersectiof.as a whols.
c pts Provide your recommendations for improvements to the signal timing, if your results indicate that improvements are needed.
The following additional information is available for the intersection:
PHF:
Arrival Types: WB: ; EB: ; NB:
HV: in all movements.
No need to consider pedestrians as overpasses are provided.
Figure Intersection Information for Problem
Step by Step Solution
There are 3 Steps involved in it
1 Expert Approved Answer
Step: 1 Unlock

Question Has Been Solved by an Expert!
Get step-by-step solutions from verified subject matter experts
Step: 2 Unlock
Step: 3 Unlock