

Question: Analyze the operating plan and make recommendations for improvement. If the latest closing market price of the stock was $41.82, what is your assessment of
Analyze the operating plan and make recommendations for improvement. If the latest closing market price of the stock was $41.82, what is your assessment of the proposed operating plan? What are some actions the company can take to improve the projected operating plan and thus the intrinsic value? These questions can be answered by creating scenarios to illustrate the quantitative changes to the data while explaining in depth as to why and how the actions can improve performance; ROIC, FCF, and ultimately the intrinsic value. 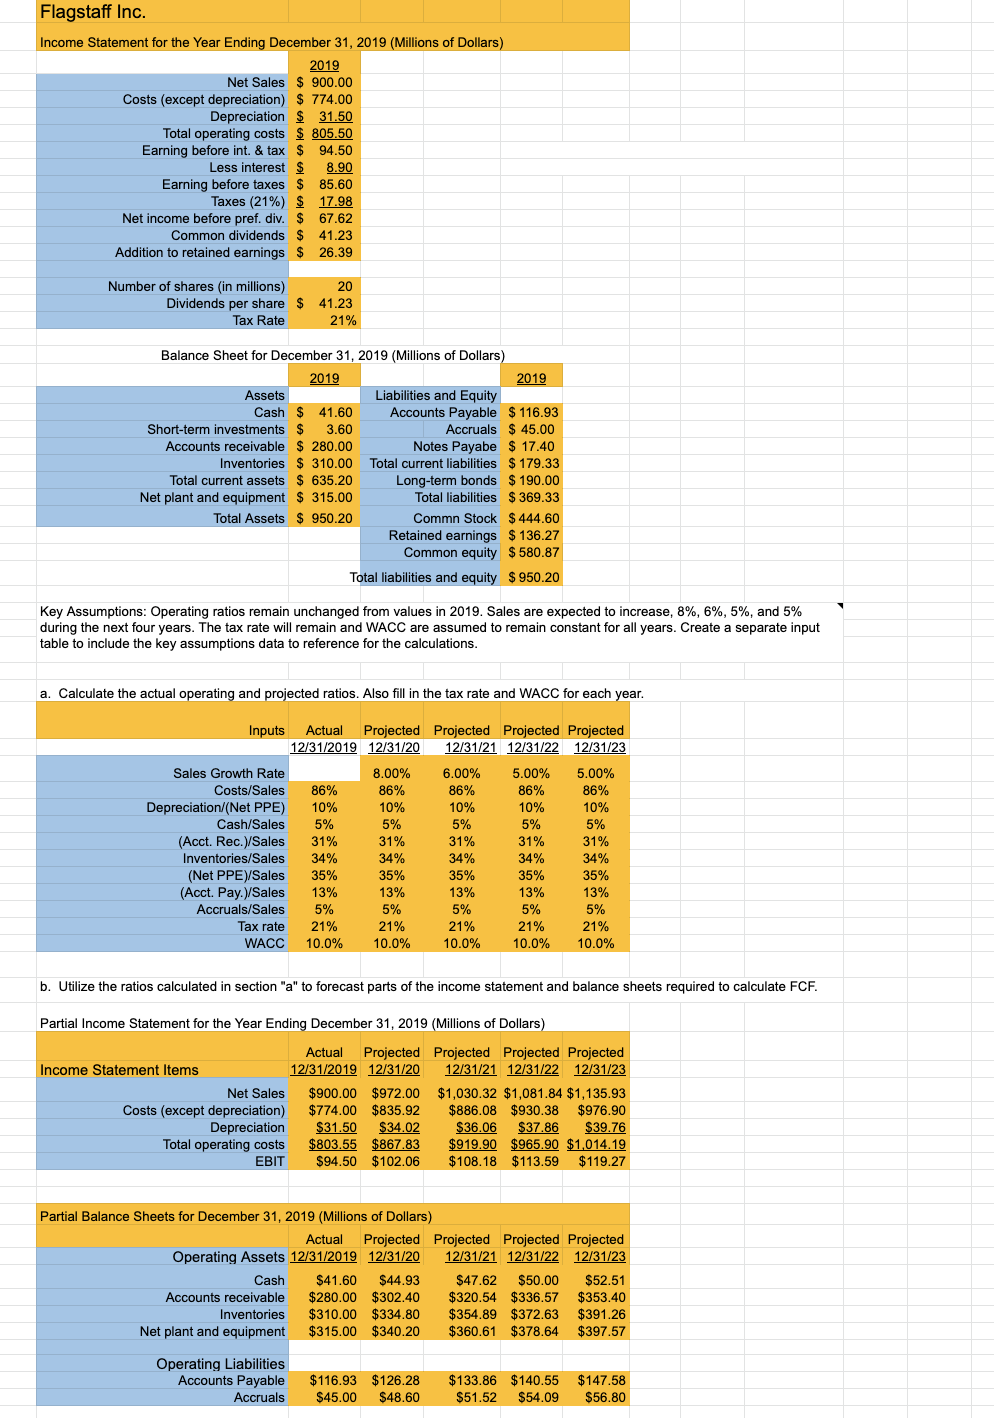
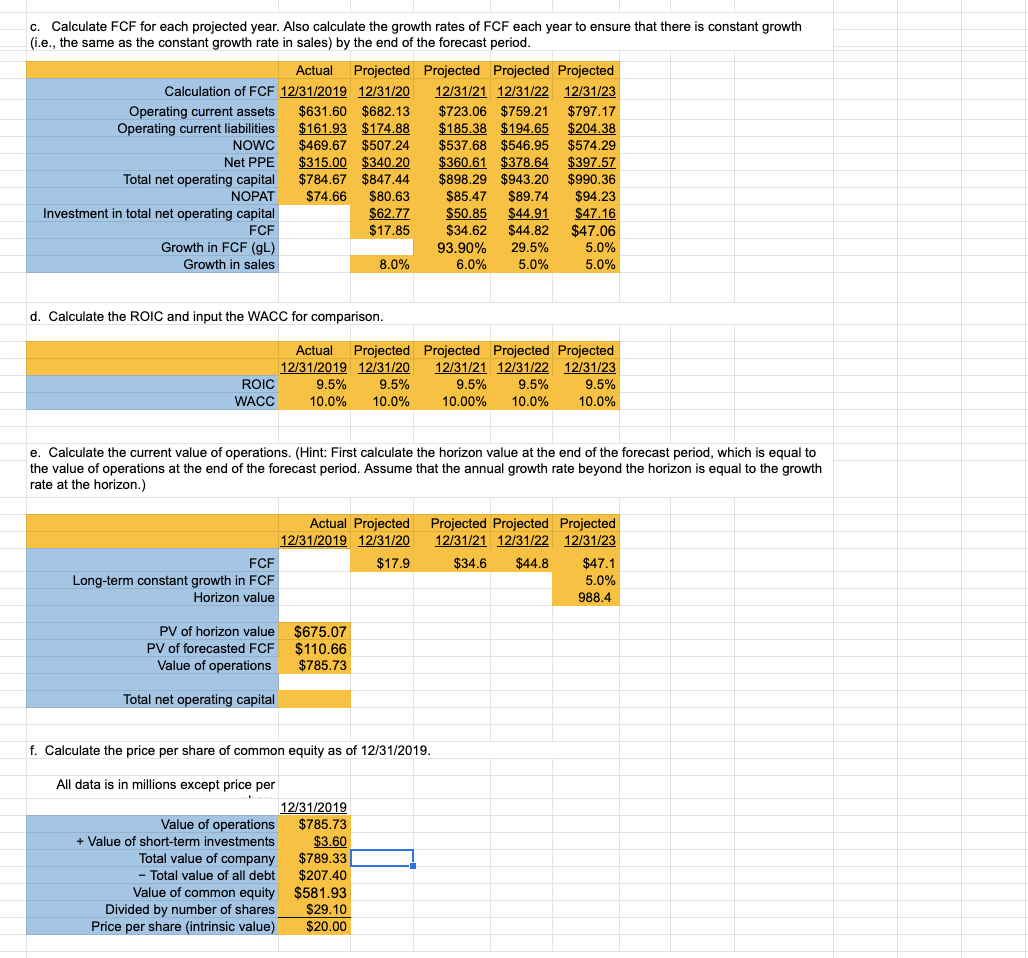
Flagstaff Inc. Income Statement for the Year Ending December 31, 2019 (Millions of Dollars) 2019 Net Sales $ 900.00 Costs (except depreciation) $ 774.00 Depreciation $ 31.50 Total operating costs $ 805.50 Earning before int. & tax $ 94.50 Less interest $ 8.90 Earning before taxes $ 85.60 Taxes (21%) $ 17.98 Net income before pref. div. $ 67.62 Common dividends $ 41.23 Addition to retained earnings $ 26.39 Number of shares in millions) 20 Dividends per share $ 41.23 Tax Rate 21% Balance Sheet for December 31, 2019 (Millions of Dollars) 2019 2019 Assets Liabilities and Equity Cash $ 41.60 Accounts Payable $ 116.93 Short-term investments $ 3.60 Accruals $ 45.00 Accounts receivable $ 280.00 Notes Payabe $ 17.40 Inventories $ 310.00 Total current liabilities $ 179.33 Total current assets $ 635.20 Long-term bonds $ 190.00 Net plant and equipment $ 315.00 Total liabilities $369.33 Total Assets $ 950.20 Commn Stock $ 444.60 Retained earnings $136.27 Common equity $580.87 Total liabilities and equity $ 950.20 Key Assumptions: Operating ratios remain unchanged from values in 2019. Sales are expected to increase, 8%, 6%, 5%, and 5% during the next four years. The tax rate will remain and WACC are assumed to remain constant for all years. Create a separate input table to include the key assumptions data to reference for the calculations. a. Calculate the actual operating and projected ratios. Also fill in the tax rate and WACC for each year. Inputs Actual Projected Projected Projected Projected 12/31/2019 12/31/20 12/31/21 12/31/22 12/31/23 Sales Growth Rate 8.00% 6.00% 5.00% 5.00% Costs/Sales 86% 86% 86% 86% 86% Depreciation/(Net PPE) 10% 10% 10% 10% 10% Cash/Sales 5% 5% 5% 5% 5% (Acct. Rec.)/Sales 31% 31% 31% 31% 31% Inventories/Sales 34% 34% 34% 34% 34% (Net PPE)/Sales 35% 35% 35% 35% 35% (Acct. Pay.)/Sales 13% 13% 13% 13% 13% Accruals/Sales 5% 5% 5% 5% 5% Tax rate 21% 21% 21% 21% 21% WACC 10.0% 10.0% 10.0% 10.0% 10.0% b. Utilize the ratios calculated in section "a" to forecast parts of the income statement and balance sheets required to calculate FCF. Partial Income Statement for the Year Ending December 31, 2019 (Millions of Dollars) Actual Projected Projected Projected Projected Income Statement Items 12/31/2019 12/31/20 12/31/21 12/31/22 12/31/23 Net Sales $900.00 $972.00 $1,030.32 $1,081.84 $1,135.93 Costs (except depreciation) $774.00 $835.92 $886.08 $930.38 $976.90 Depreciation $31.50 $34.02 $36.06 $37.86 $ $39.76 Total operating costs $803.55 $867.83 $919.90 $965.90 $1,014.19 EBIT $94.50 $102.06 $108.18 $113.59 $119.27 Partial Balance Sheets for December 31, 2019 (Millions of Dollars) Actual Projected Projected Projected Projected Operating Assets 12/31/2019 12/31/20 12/31/21 12/31/22 12/31/23 Cash $41.60 $44.93 $47.62 $50.00 $52.51 Accounts receivable $280.00 $302.40 $320.54 $336.57 $353.40 Inventories $310.00 $334.80 $354.89 $372.63 $391.26 Net plant and equipment $315.00 $340.20 $360.61 $378.64 $397.57 Operating Liabilities Accounts Payable Accruals $116.93 $126.28 $45.00 $48.60 $133.86 $140.55 $147.58 $51.52 $54.09 $56.80 c. Calculate FCF for each projected year. Also calculate the growth rates of FCF each year to ensure that there is constant growth (i.e., the same as the constant growth rate in sales) by the end of the forecast period. Actual Projected Projected Projected Projected Calculation of FCF 12/31/2019 12/31/20 12/31/21 12/31/22 12/31/23 Operating current assets $631.60 $682.13 $723.06 $759.21 $797.17 Operating current liabilities $161.93 $174.88 $185.38 $194.65 $204.38 NOWC $469.67 $507.24 $537.68 $546.95 $574.29 Net PPE $315.00 $340.20 $360.61 $378.64 $397.57 Total net operating capital $784.67 $847.44 $898.29 $943.20 $990.36 NOPAT $74.66 $80.63 $85.47 $89.74 $94.23 Investment in total net operating capital $62.77 $50.85 $44.91 $47.16 FCF $17.85 $34.62 $44.82 $47.06 Growth in FCF (SL) 93.90% 29.5% 5.0% Growth in sales 8.0% 6.0% 5.0% 5.0% d. Calculate the ROIC and input the WACC for comparison. Actual Projected Projected Projected Projected 12/31/2019 12/31/20 12/31/21 12/31/22 12/31/23 ROIC 9.5% 9.5% 9.5% 9.5% 9.5% WACC 10.0% 10.0% 10.00% 10.0% 10.0% e. Calculate the current value of operations. (Hint: First calculate the horizon value at the end of the forecast period, which is equal to the value of operations at the end of the forecast period. Assume that the annual growth rate beyond the horizon is equal to the growth rate at the horizon.) Actual Projected 12/31/2019 12/31/20 FCF $17.9 Long-term constant growth in FCF Horizon value Projected Projected Projected 12/31/21 12/31/22 12/31/23 $34.6 $44.8 $47.1 5.0% 988.4 PV of horizon value PV of forecasted FCF Value of operations $675.07 $110.66 $785.73 Total net operating capital f. Calculate the price per share of common equity as of 12/31/2019. All data is in millions except price per 12/31/2019 Value of operations $785.73 + Value of short-term investments $3.60 Total value of company $789.33 - Total value of all debt $207.40 Value of common equity $581.93 Divided by number of shares $29.10 Price per share (intrinsic value) $20.00 Flagstaff Inc. Income Statement for the Year Ending December 31, 2019 (Millions of Dollars) 2019 Net Sales $ 900.00 Costs (except depreciation) $ 774.00 Depreciation $ 31.50 Total operating costs $ 805.50 Earning before int. & tax $ 94.50 Less interest $ 8.90 Earning before taxes $ 85.60 Taxes (21%) $ 17.98 Net income before pref. div. $ 67.62 Common dividends $ 41.23 Addition to retained earnings $ 26.39 Number of shares in millions) 20 Dividends per share $ 41.23 Tax Rate 21% Balance Sheet for December 31, 2019 (Millions of Dollars) 2019 2019 Assets Liabilities and Equity Cash $ 41.60 Accounts Payable $ 116.93 Short-term investments $ 3.60 Accruals $ 45.00 Accounts receivable $ 280.00 Notes Payabe $ 17.40 Inventories $ 310.00 Total current liabilities $ 179.33 Total current assets $ 635.20 Long-term bonds $ 190.00 Net plant and equipment $ 315.00 Total liabilities $369.33 Total Assets $ 950.20 Commn Stock $ 444.60 Retained earnings $136.27 Common equity $580.87 Total liabilities and equity $ 950.20 Key Assumptions: Operating ratios remain unchanged from values in 2019. Sales are expected to increase, 8%, 6%, 5%, and 5% during the next four years. The tax rate will remain and WACC are assumed to remain constant for all years. Create a separate input table to include the key assumptions data to reference for the calculations. a. Calculate the actual operating and projected ratios. Also fill in the tax rate and WACC for each year. Inputs Actual Projected Projected Projected Projected 12/31/2019 12/31/20 12/31/21 12/31/22 12/31/23 Sales Growth Rate 8.00% 6.00% 5.00% 5.00% Costs/Sales 86% 86% 86% 86% 86% Depreciation/(Net PPE) 10% 10% 10% 10% 10% Cash/Sales 5% 5% 5% 5% 5% (Acct. Rec.)/Sales 31% 31% 31% 31% 31% Inventories/Sales 34% 34% 34% 34% 34% (Net PPE)/Sales 35% 35% 35% 35% 35% (Acct. Pay.)/Sales 13% 13% 13% 13% 13% Accruals/Sales 5% 5% 5% 5% 5% Tax rate 21% 21% 21% 21% 21% WACC 10.0% 10.0% 10.0% 10.0% 10.0% b. Utilize the ratios calculated in section "a" to forecast parts of the income statement and balance sheets required to calculate FCF. Partial Income Statement for the Year Ending December 31, 2019 (Millions of Dollars) Actual Projected Projected Projected Projected Income Statement Items 12/31/2019 12/31/20 12/31/21 12/31/22 12/31/23 Net Sales $900.00 $972.00 $1,030.32 $1,081.84 $1,135.93 Costs (except depreciation) $774.00 $835.92 $886.08 $930.38 $976.90 Depreciation $31.50 $34.02 $36.06 $37.86 $ $39.76 Total operating costs $803.55 $867.83 $919.90 $965.90 $1,014.19 EBIT $94.50 $102.06 $108.18 $113.59 $119.27 Partial Balance Sheets for December 31, 2019 (Millions of Dollars) Actual Projected Projected Projected Projected Operating Assets 12/31/2019 12/31/20 12/31/21 12/31/22 12/31/23 Cash $41.60 $44.93 $47.62 $50.00 $52.51 Accounts receivable $280.00 $302.40 $320.54 $336.57 $353.40 Inventories $310.00 $334.80 $354.89 $372.63 $391.26 Net plant and equipment $315.00 $340.20 $360.61 $378.64 $397.57 Operating Liabilities Accounts Payable Accruals $116.93 $126.28 $45.00 $48.60 $133.86 $140.55 $147.58 $51.52 $54.09 $56.80 c. Calculate FCF for each projected year. Also calculate the growth rates of FCF each year to ensure that there is constant growth (i.e., the same as the constant growth rate in sales) by the end of the forecast period. Actual Projected Projected Projected Projected Calculation of FCF 12/31/2019 12/31/20 12/31/21 12/31/22 12/31/23 Operating current assets $631.60 $682.13 $723.06 $759.21 $797.17 Operating current liabilities $161.93 $174.88 $185.38 $194.65 $204.38 NOWC $469.67 $507.24 $537.68 $546.95 $574.29 Net PPE $315.00 $340.20 $360.61 $378.64 $397.57 Total net operating capital $784.67 $847.44 $898.29 $943.20 $990.36 NOPAT $74.66 $80.63 $85.47 $89.74 $94.23 Investment in total net operating capital $62.77 $50.85 $44.91 $47.16 FCF $17.85 $34.62 $44.82 $47.06 Growth in FCF (SL) 93.90% 29.5% 5.0% Growth in sales 8.0% 6.0% 5.0% 5.0% d. Calculate the ROIC and input the WACC for comparison. Actual Projected Projected Projected Projected 12/31/2019 12/31/20 12/31/21 12/31/22 12/31/23 ROIC 9.5% 9.5% 9.5% 9.5% 9.5% WACC 10.0% 10.0% 10.00% 10.0% 10.0% e. Calculate the current value of operations. (Hint: First calculate the horizon value at the end of the forecast period, which is equal to the value of operations at the end of the forecast period. Assume that the annual growth rate beyond the horizon is equal to the growth rate at the horizon.) Actual Projected 12/31/2019 12/31/20 FCF $17.9 Long-term constant growth in FCF Horizon value Projected Projected Projected 12/31/21 12/31/22 12/31/23 $34.6 $44.8 $47.1 5.0% 988.4 PV of horizon value PV of forecasted FCF Value of operations $675.07 $110.66 $785.73 Total net operating capital f. Calculate the price per share of common equity as of 12/31/2019. All data is in millions except price per 12/31/2019 Value of operations $785.73 + Value of short-term investments $3.60 Total value of company $789.33 - Total value of all debt $207.40 Value of common equity $581.93 Divided by number of shares $29.10 Price per share (intrinsic value) $20.00
Step by Step Solution
There are 3 Steps involved in it

Get step-by-step solutions from verified subject matter experts