

Question: Analyze the patient-satisfaction data below for near-linear dependence by using Equation 9.3 (attached also) to compute the variance inflation factor. Does this data exhibit multicollinearity?
Analyze the patient-satisfaction data below for near-linear dependence by using Equation 9.3 (attached also) to compute the variance inflation factor. Does this data exhibit multicollinearity?
Submit your R code and any output of the code to include tables and graphs as indicated or For questions that require a written response elaborate
DATA
https://drive.google.com/file/d/1e5Bux6nxslj-_yd_VgQLwKhpu7xJzwM5/view?usp=sharing
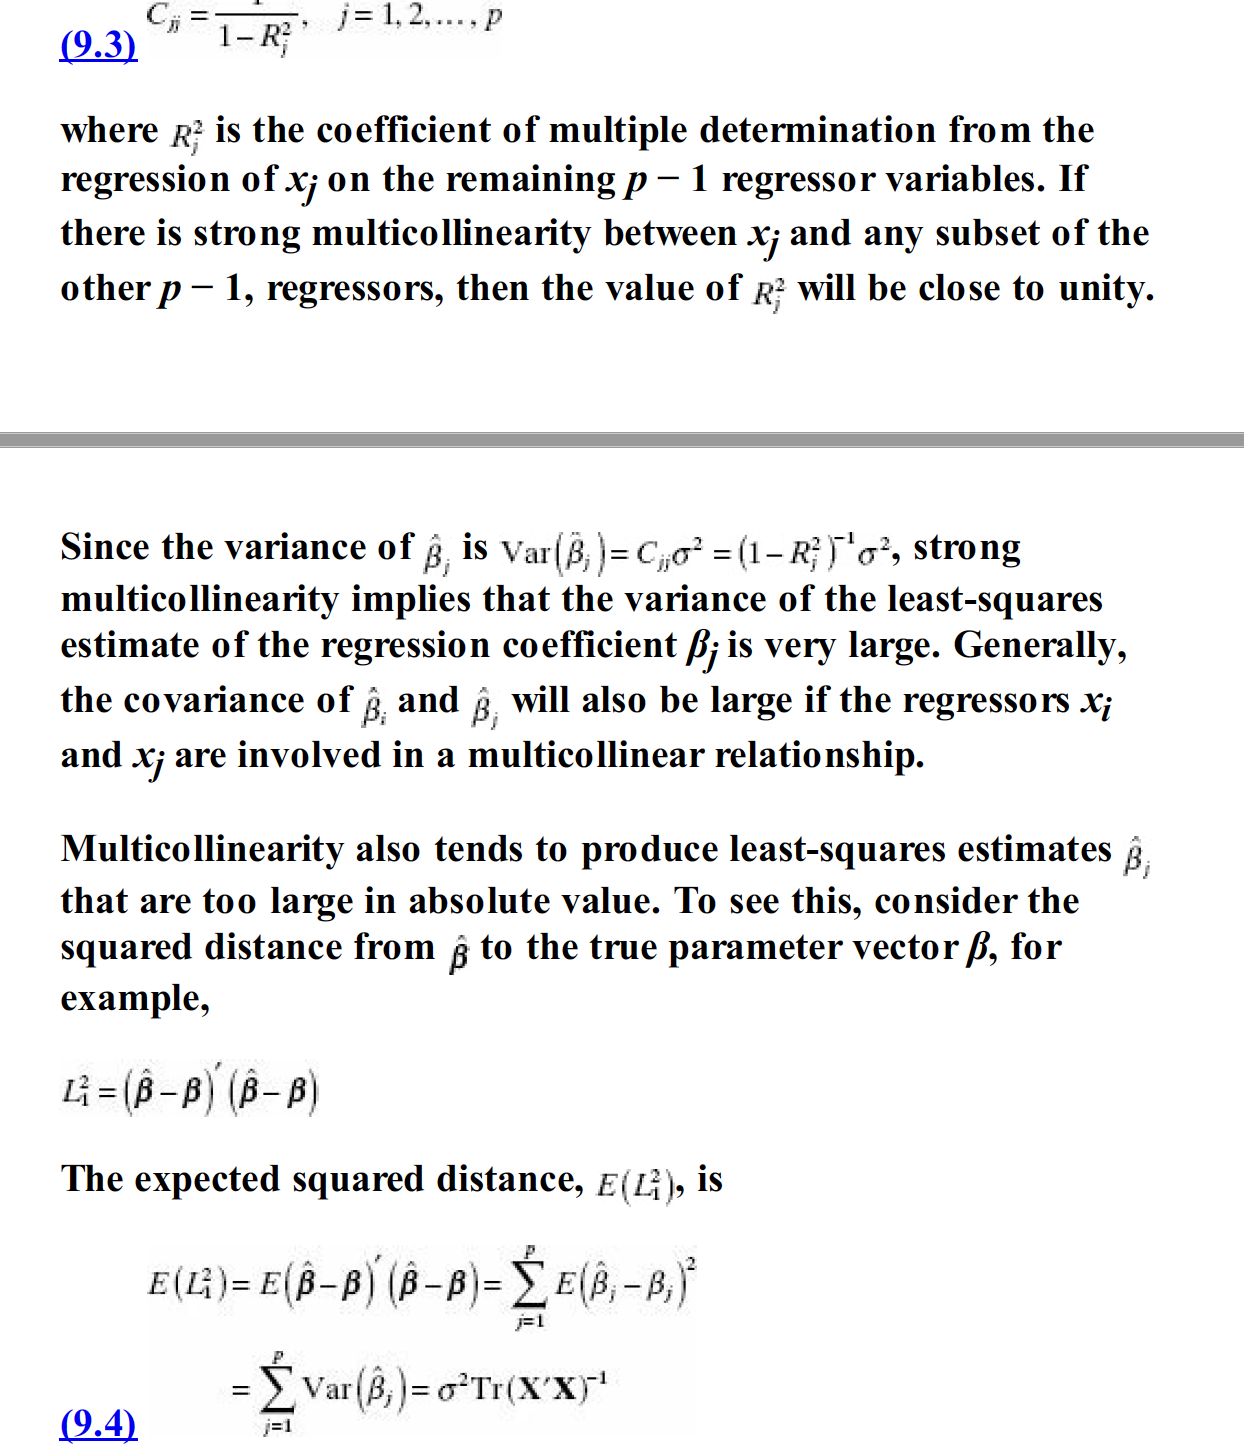
(9.3) "-1-R? ' 1= 1, 2,... . P where R? is the coefficient of multiple determination from the regression of x; on the remaining p - 1 regressor variables. If there is strong multicollinearity between x; and any subset of the other p - 1, regressors, then the value of R? will be close to unity. Since the variance of B, is Var(B, )= C,jo? = (1-R; )'of, strong multicollinearity implies that the variance of the least-squares estimate of the regression coefficient B; is very large. Generally, the covariance of ; and g, will also be large if the regressors xi and x; are involved in a multicollinear relationship. Multicollinearity also tends to produce least-squares estimates B; that are too large in absolute value. To see this, consider the squared distance from ; to the true parameter vector B, for example, LA = (B -B) ( B -B) The expected squared distance, E(L), is E( L) = E( B-B) ( B -B) = EE(B, -B, ) = [ Var (B, ) = G'TH(X'X)' (9.4)
Step by Step Solution
There are 3 Steps involved in it

Get step-by-step solutions from verified subject matter experts